Figures & data
Figure 1 XRD pattern of prepared films deposited on glass substrates (a) SnO2 doped with Fe (b) SnO2 doped with Cu.
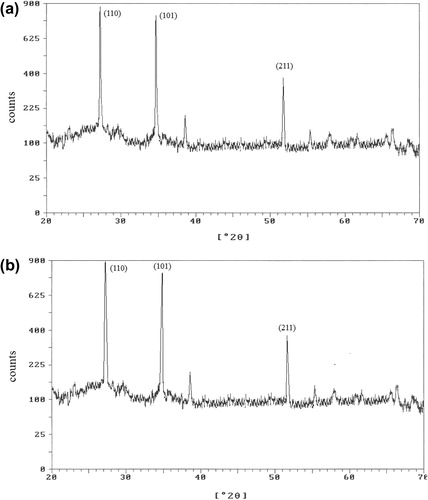
Table 1 Summary of the XRD parameters and crystallite size mean grain size of samples for peak (1 1 0).
Figure 2 AFM images of prepared films deposited on glass substrates (a) SnO2 doped with Fe (b) SnO2 doped with Cu.
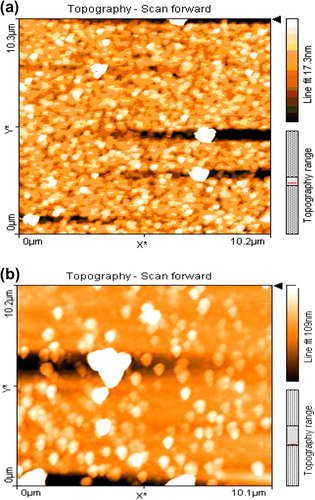
Figure 3 The variation of the carrier concentration with temperature (a) SnO2 doped with Fe (b) SnO2 doped with Cu.
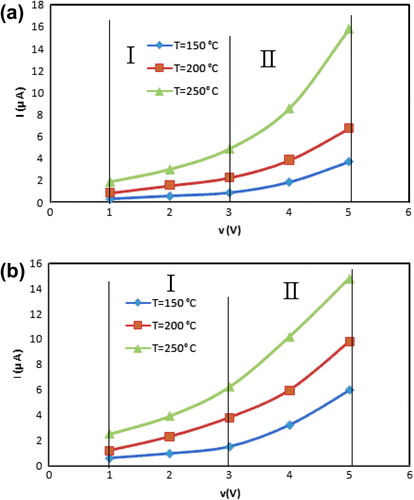
Table 2 Density of states at the Fermi level of samples.
Table 3 Activation energy for all samples at region I and II.
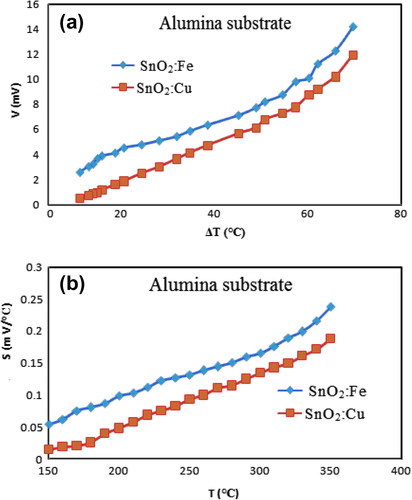
Figure 4 (a) The variation of the potential with Temperature difference, (b) the variation of the Seebeck coefficient with temperature.
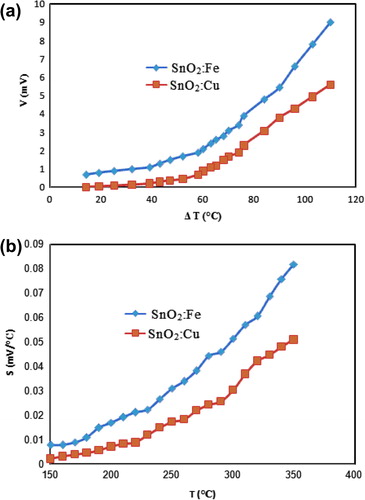
Figure 5 (a) The variation of the carrier concentration with temperature, (b) variation of charge carrier mobility with temperature.
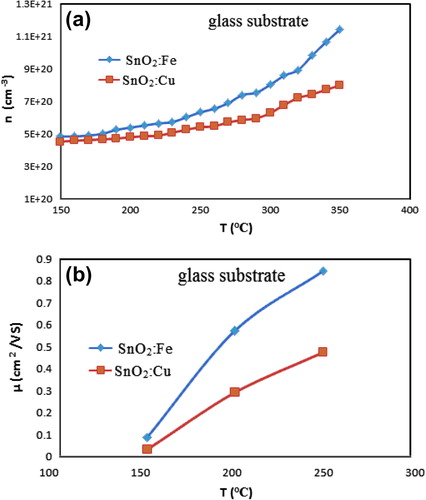
Figure 6 (a) The variation of the potential with temperature difference, (b) the variation of the Seebeck coefficient with temperature.