Figures & data
Table 1 Properties of natural Jordanian kaolin.
Figure 1 XRD patterns of Jordanian kaolin (a) and metakaolin at 650 °C (b).
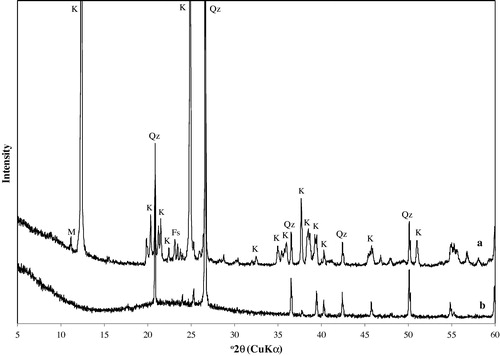
Table 2 Phase composition of the obtained zeolite products (wt.%) was performed using the Rietveld method with DIFFRACplus TOPAS software.
Figure 2 XRD patterns of zeolite A and associated phases obtained by hydrothermal synthesis (a) unreacted metakaolin, (b) 1.0 M NaOH, (c) 1.5 M NaOH, (d) 2.0 M NaOH, (e) 2.5 M NaOH, (f) 3.0 M NaOH, (g) 3.5 M NaOH, and (h) 4.0 M NaOH, (i) commercial zeolite A. A: zeolite A, S: hydroxysodalite, Qz: quartz.
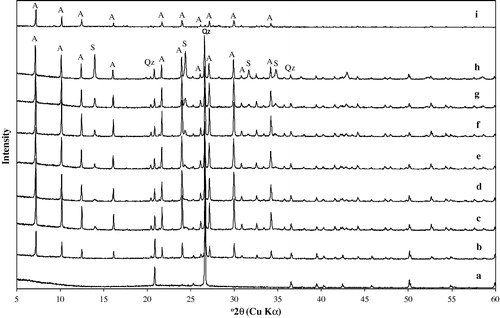
Figure 3 FTIR spectra of zeolite A and associated phases obtained by hydrothermal synthesis: (a) unreacted metakaolin, (b) 1.0 M NaOH, (c) 1.5 M NaOH, (d) 2.0 M NaOH, (e) 2.5 M NaOH, (f) 3.0 M NaOH, (g) 3.5 M NaOH, (h) 4.0 M NaOH, and (i) commercial zeolite A (Fluka No. 69836).
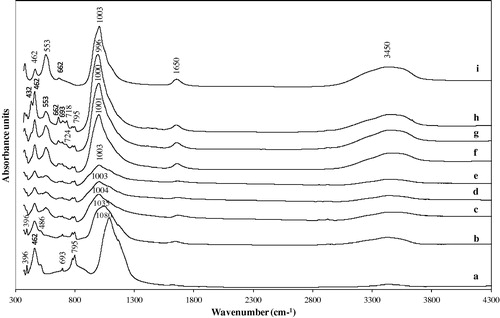
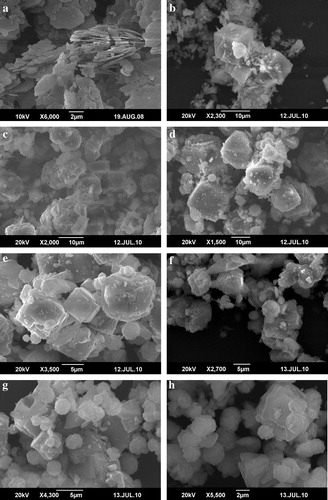
Figure 4 SEM micrographs showing the occurrence of zeolite A and associated phases obtained by hydrothermal synthesis: (a) hexagonal platy crystals of untreated kaolin, (b) very well developed cubes of zeolite A and relicts of metakaolin, (c) zeolite A probably formed before hydroxysodalite (HS), as shown by the occurrence of HS crystals growing at the surface of zeolite A. (d–f) Spheroidal aggregates of HS that grew out onto the surface of cubic crystals of zeolite A, showing penetration twining, and (g–h) lephispheric morphology of HS associated to cubic crystals of zeolite.