
Figures & data
Figure 1 Gamma spectrum for a canned seafood sample, where R, T, and K indicate 226R, 232Th, and 40K, respectively.
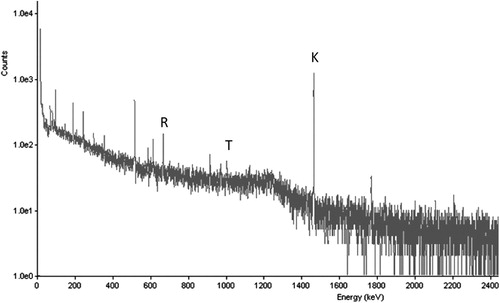
Figure 2 Activity concentration of 226Ra.
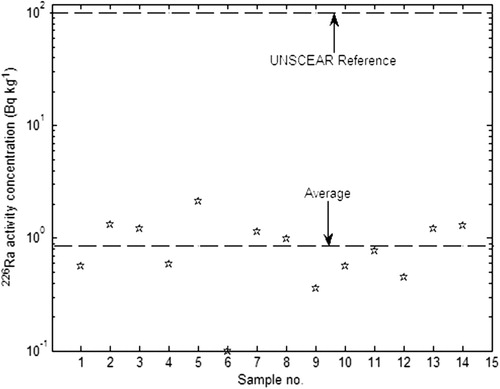
Table 1 Brand names of types of samples investigated in this study.
Figure 3 Activity concentration of 40K.
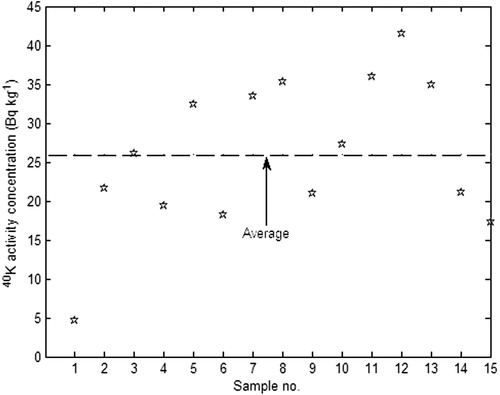
Table 2 Activity concentrations (Bq kg−1) of 232Th, 226Ra, and 40K in seafood samples in this study, compared with those reported in the literature.
Table 3 Activity concentrations (Bq kg−1) of 232Th, 226Ra, and 40K in various foodstuffs reported in the literature.