Figures & data
Figure 1 Relation between the bulk etch rate (μm/h) and the γ-dose (kGy).
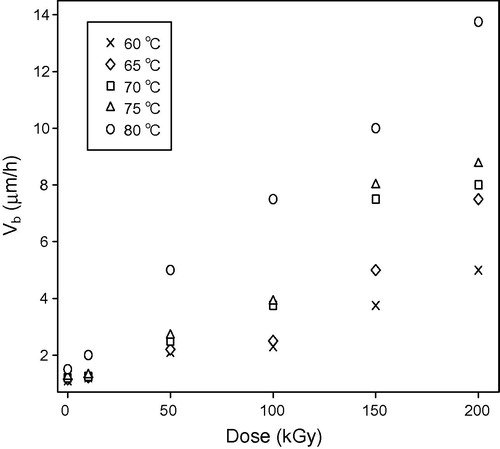
Figure 2 Relation between ln() and
.
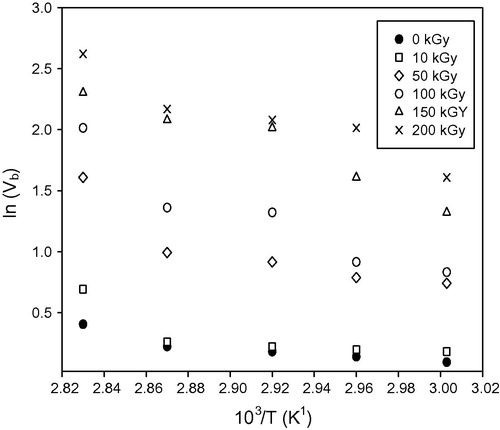
Table 1 Variation of the bulk activation energy of CR-39 detector with absorbed gamma dose.
Figure 3 Relation between the track density (track/mm2) and the γ-dose (kGy).
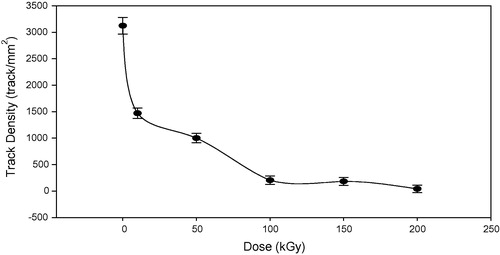
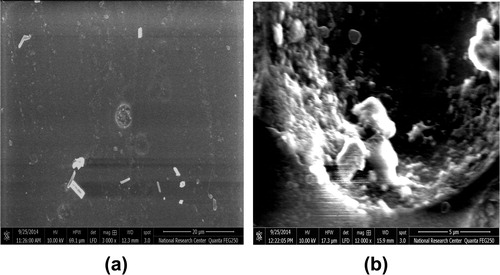
Figure 4 Typical images showing the increment in the track volume (a) pristine (b) 50 kGy (c) 200 kGy and illustrating the tracks overlapping with increase in the gamma absorbed dose (d) 50 kGy (e) 200 kGy.
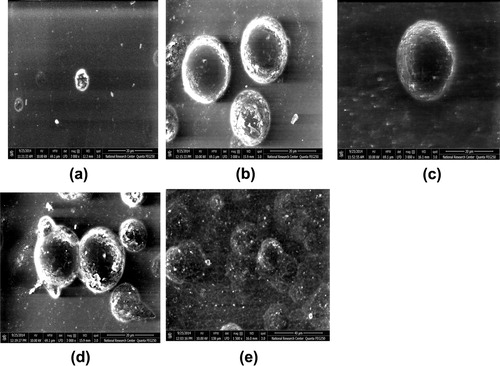
Figure 5 Relation between the degree of crystallinity (%) and the γ-dose (kGy) before etching.
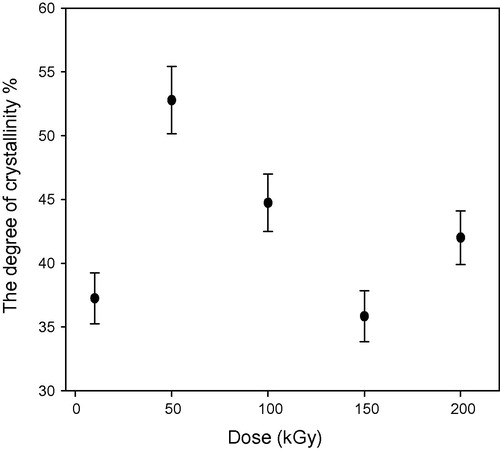
Figure 6 Relation between the degree of crystallinity (%) and the γ-dose (kGy) for pristine and irradiated samples after etching process (study the etching effect only).
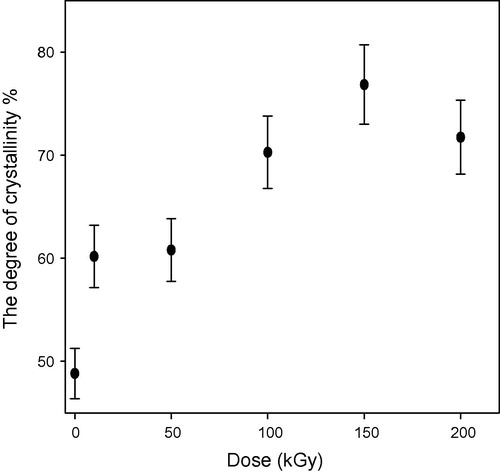
Figure 7 Relation between the degree of crystallinity (%) and the γ-dose (kGy) for pristine and irradiated samples after etching (study the effect of etching and dose).
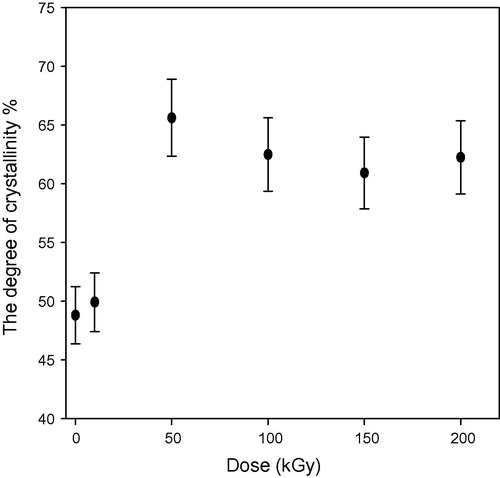
Figure 8 Comparison between the degree of crystallinity (%) and the γ-dose (kGy) for un-etched and etched samples.
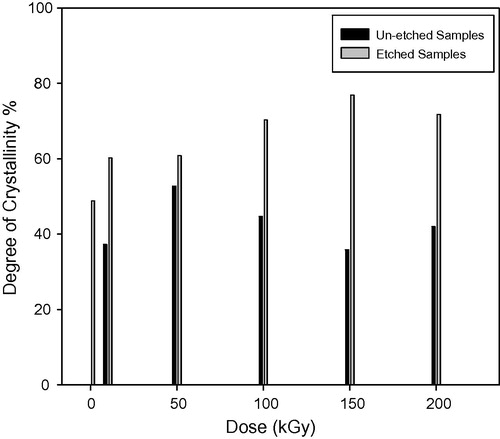
Figure 9 FTIR spectra of the un-irradiated sample and etched un-irradiated CR-39 sample.
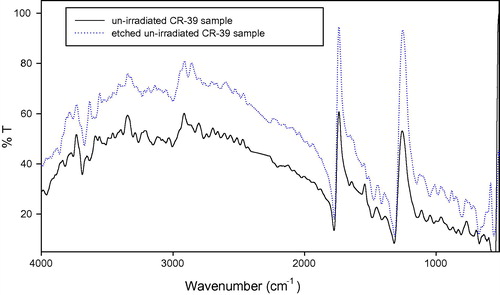
Figure 10 Typical images showing the presence of salt in polymeric material (a) pristine (b) 200 kGy irradiated sample.