
Figures & data
Table 1 Chemical and physical properties of miswak fibers and alkali treated miswak fibers.
Table 2 Spectra data of miswak fibers and alkali treated miswak fibers.
Figure 1 The SEM images of Miswak-F and AT-Miswak-F at magnifications of 400 and 800×.
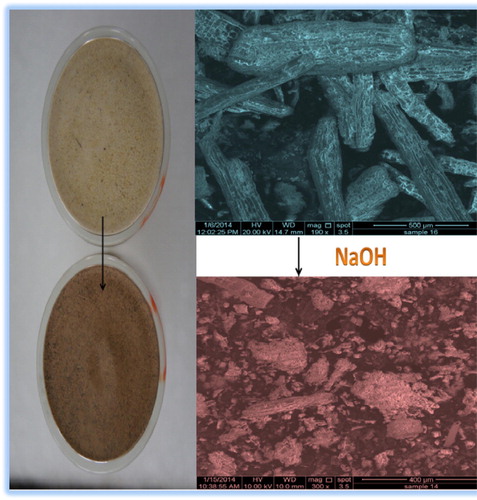
Figure 2 Surface morphology of AT-Miswak-F using scanning electron microscopy (SEM) at magnifications 800 and 1600×.
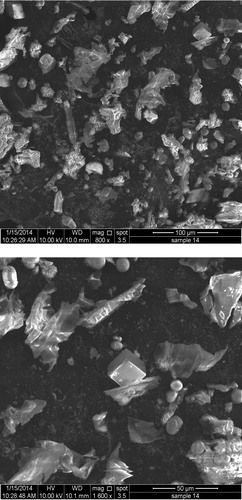
Figure 3 (a) pHZPC of miswak fiber (Miswak-F) and miswak fibers after alkali treatment (AT-Miswak-F) & (b) effect of initial pH on the Miswak-F and AT-Miswak-F.
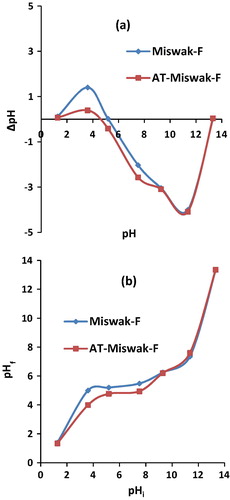
Table 3 Composition of miswak fibers and alkali treated miswak fibers.
Figure 4 Effect of initial pH on the sorption of iron (III), cobalt (II) and nickel (II) onto AT-Miswak-F.
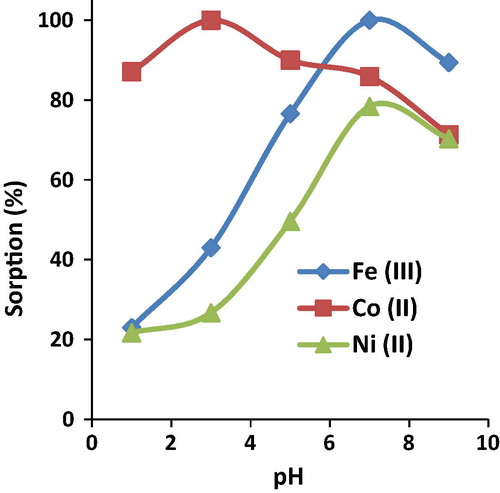
Figure 5 Effect of initial platinum concentration on the extraction of iron (III), cobalt (II) and nickel (II) onto AT-Miswak-F.
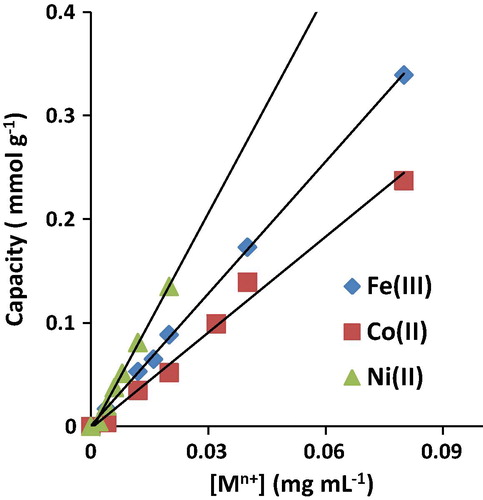
Figure 6 Effect of interfering metal ions on the sorption of iron (III), cobalt (II) and nickel (II) onto AT-Miswak-F.
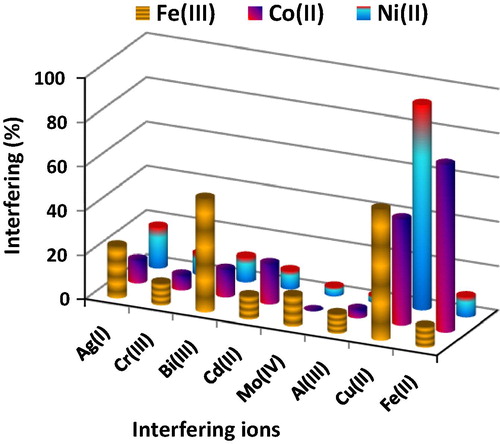
Table 4 Conductivity and electronic spectral data and their assignments for Miswak-F, AT-Miswak-F and metal: AT-Miswak-F complexes.
Figure 7 Infrared spectra of AT-Miswak-F: Metal complexes.
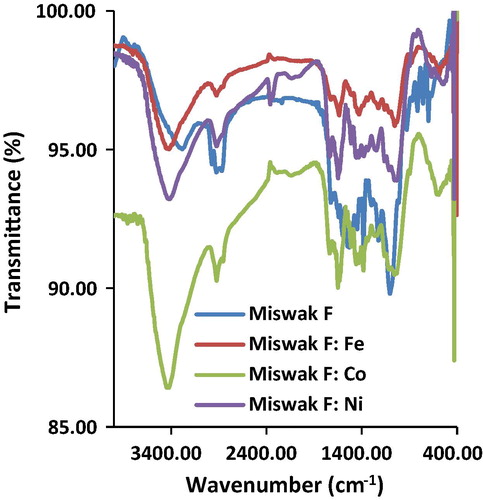
Table 5 Recovery of iron (III) from underground water using AT-Miswak fibers.
Table 6 Determination of iron in certified water samples using batch technique.
Table 7 Determination of metal ions in wastewater samples using dynamic technique.