Figures & data
Fig. 1 (a) Chromatogram of the standard gallic acid and (b) chromatogram of the polyphenolic extract of T. chebula fruits.
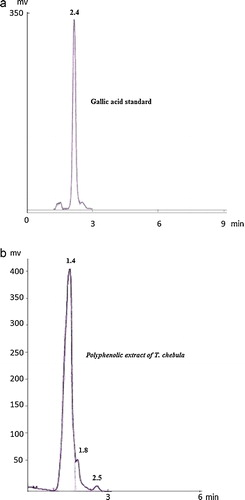
Fig. 2 The reducing power activity of the polyphenolic extract of T. chebula fruits. Data are presented as the means ± SEM of triplicates. ***p < 0.001 from the control.
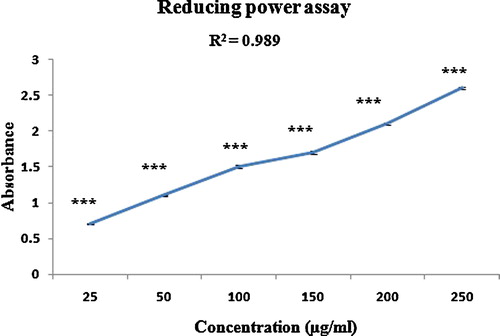
Fig. 3 Total antioxidant capacities of the polyphenolic extract of T. chebula fruits and ascorbic acid. Data are presented as the means ± SEM of triplicates. *p < 0.05; ***p < 0.001 from the control.
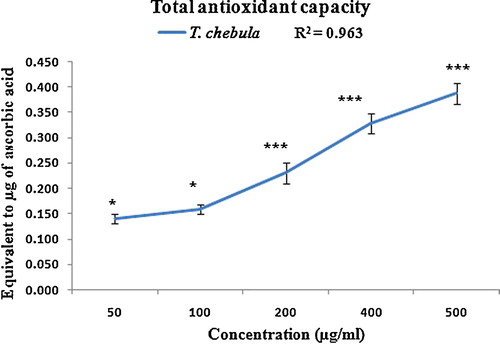
Fig. 4 DPPH radical scavenging activity of the T. chebula extract and ascorbic acid. Data are presented as the means ± SEM of triplicates. ***p < 0.001 from the control.
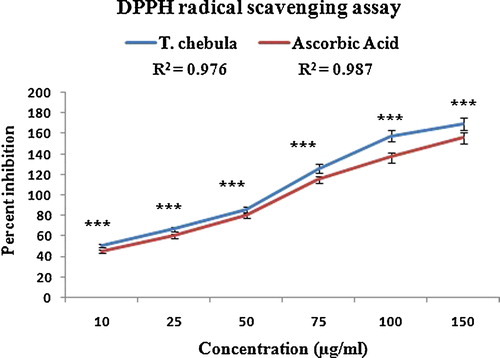
Fig. 5 Nitric oxide radical scavenging activity of the extract of T. chebula fruits and ascorbic acid. Data are presented as the means ± SEM of triplicates. ***p < 0.001 from the control.
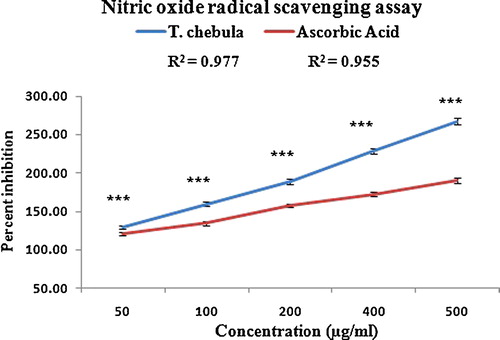
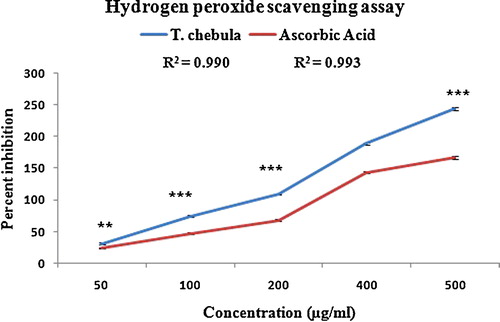
Fig. 6 Hydrogen peroxide radical scavenging activity of the polyphenolic extract of T. chebula fruits and ascorbic acid. Data are presented as the means ± SEM of triplicates. **p < 0.01; ***p < 0.001 from the control.