Figures & data
Table 1 The structure and the observed for the 48 MK801 derivatives (training and test set).
Fig. 1 Schematic diagram of MK801 skeleton.
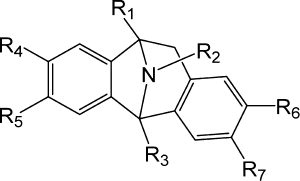
Table 2 The values of the 16 chemical descriptors.
Table 3 The correlation matrix (Pearson (n)) between different obtained descriptors.
Fig. 2 The principal components and there variances.
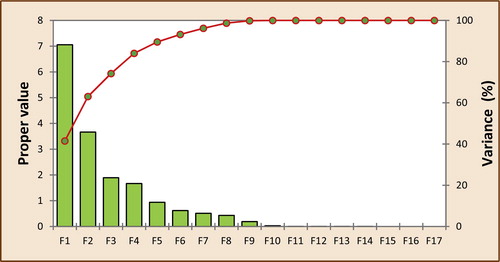
Fig. 3 Correlation circles.
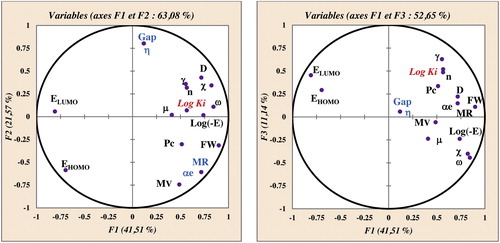
Fig. 4 Cartesian diagram showing the separation between the tree regions and the dispersal of different molecules by groups.
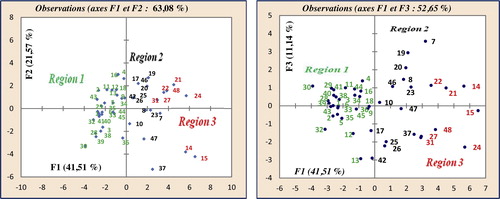
Table 4 The observed, the predicted activities (Log Ki), and residue according to different methods for the 38 MK801 derivatives (training set).
Table 5 The observed, the predicted activities (Log (Ki)), and residue according to MLR and MNLR for the 10 tested compounds (test set).
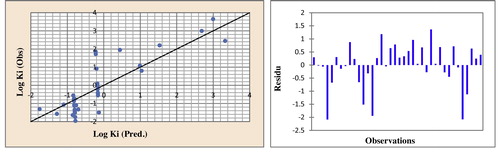
Fig. 5 Correlations of observed and predicted activities and the residues values calculated using MLR.
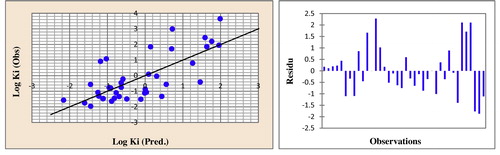
Fig. 6 Correlations of observed and predicted activities and the residues values calculated using MNLR.
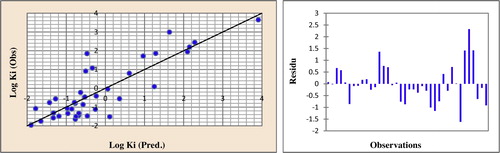
Fig. 7 Correlations of observed and predicted activities and residues values calculated using ANN.
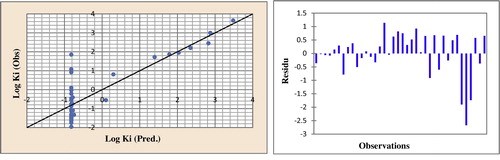
Fig. 8 Correlations of observed and predicted activities and residues values calculated using CV.