Figures & data
Table 1 Haematocrit value and ratios of the liver and kidney-to-body weight in the different experimental groups.
Table 2 Kidney and liver function parameters in the different experimental groups.
Fig. 1 Levels of renal tissue MDA in different experimental groups. The results are the means and standard errors. *Significance compared to the sham control groups.
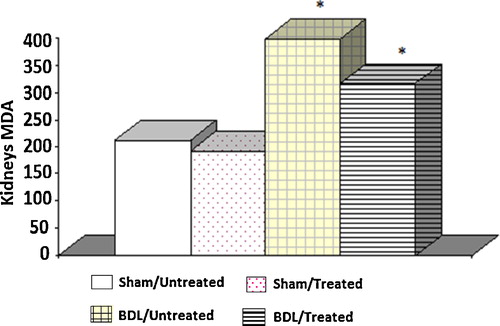
Fig. 2 Tissue glutathione levels in different experimental groups. The results are the means and standard errors. *Significance compared to the sham control groups. ¥Significance between groups III and IV.
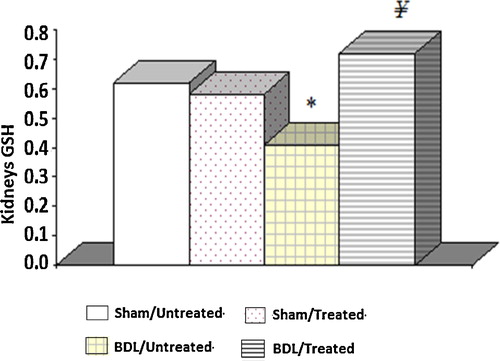
Fig. 3 Tissue catalase activity in the different experimental groups. The results are the means and standard errors. *Significance compared to the sham control groups. ¥Significance between groups III and IV.
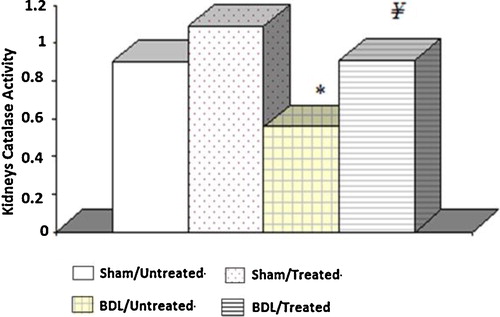
Fig. 4 Tissue NO levels in the different experimental groups. The results are the means and standard errors. *Significance compared to the sham control groups. ¥Significance between groups III and IV.
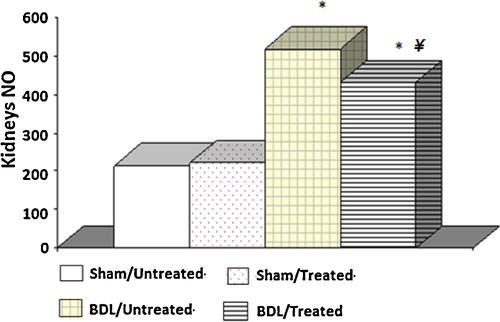
Fig. 5 (a) Photomicrograph of a liver of a sham untreated albino rat showing normal hepatic lobulation and normal hepatic plates (H&E 400×). (b) Photomicrograph of a liver of a sham treated albino rat showing normal hepatic plates; note hepatocytes with normal cytoplasmic density and normal nuclei (H&E 1000×). (c) Photomicrograph of a liver of an albino rat 4 weeks after BDL showing severe hepatic fibrosis (H&E 400×). (d) Photomicrograph of a liver of an albino rats 4 weeks after BDL showing the hepatic lobules replaced with collagenic fibrosis (c) and the newly formed bile ducts (D). (Crossmon's trichrome 400×). (e) Photomicrograph of a liver from a BDL/Albumin treated albino rat showing degenerated areas with inflammatory cells infiltration (D) and some normal areas (n) (H&E 200×). (f) Photomicrograph of a liver from a BDL/Albumin treated albino rat showing some normal hepatocytes (arrow) (H&E 400×).
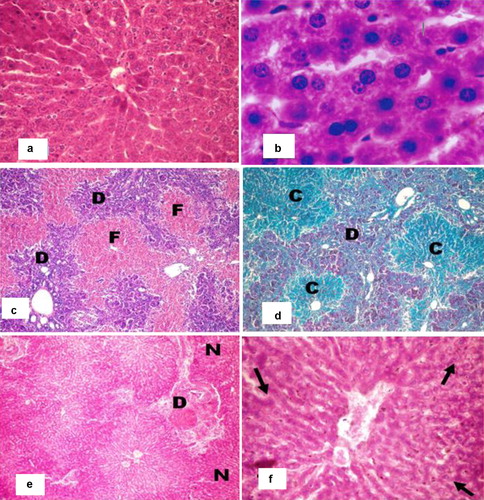
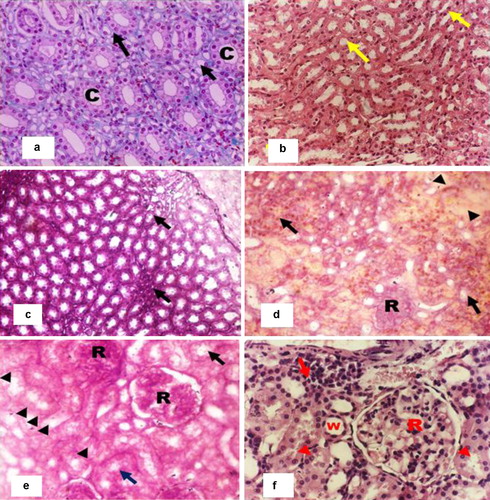
Fig. 6 (a) Photomicrograph of a renal medulla of a sham untreated albino rat showing normal thin segments of the loop of Henle (arrow) and collecting tubules (c) (H&E 320×). (b) Photomicrograph of a kidney of a sham treated albino rat showing normal thick segments of the loop of Henle (arrow) (H&E 200×). (c) Photomicrograph of a kidney from a BDL/Albumin treated albino rat showing some recovery in some renal medulla with decrease the interlobular fluid and some focal area of lymphocytic infiltration (arrow). (H&E 400×). (d) Photomicrograph of a kidney from an albino rat 4 weeks after BDL showing severe renal damage. Note the swelling of renal corpuscles (R), haemorrhage (arrow) and eosinophilic fluid (arrow head) of granulose cells (arrow head) (H&E 100×). (e) Photomicrograph of a kidney from an albino rat 4 weeks after BDL showing swelling in the renal corpuscles (R) with vacuolated and damaged epithelium of the tubules (arrow), some of which appeared to be ruptured (arrow head) (H&E 400×). (f) Photomicrograph of a kidney from a BDL/Albumin treated albino rat showing recovery in some renal corpuscles (R) and renal tubules (arrow head). Note the infiltration of the inflammatory cell (arrow) and wide tubules (w) (H&E 400×).