Figures & data
Fig. 1 Schematic structure of a two-compartment microbial fuel cell.
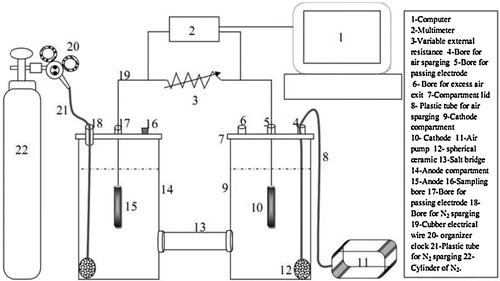
Table 1 Levels of the investigated factors in the central composite design.
Table 2 The central composite design for three independent variables: temperature (Y1), initial anodic compartment pH (Y2), and salt bridge component concentrations (agar and KCl) (Y3).
Fig. 2 The response of voltage yield (mV) as a function of initial pH and temperature (°C) based on the central composite design results.
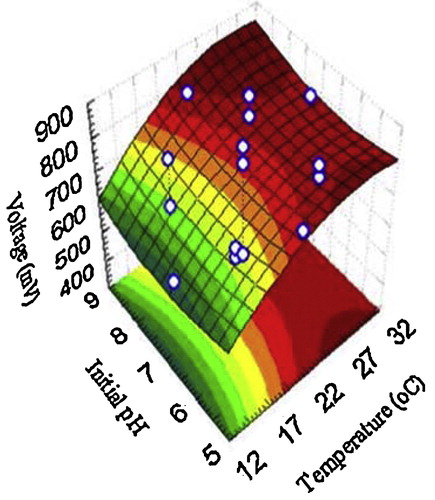
Fig. 3 The response of voltage yield (mV) as a function of salt bridge component concentrations (g/100 ml) and temperature (°C) based on the central composite design results.
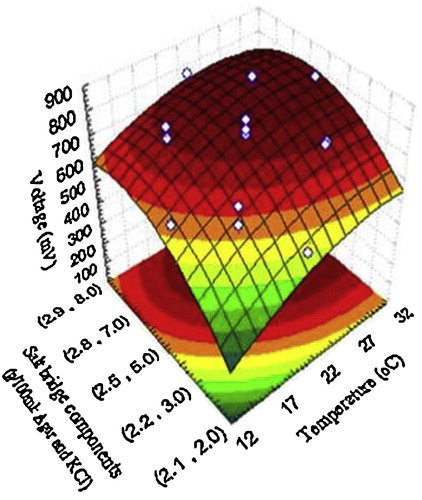
Fig. 4 The response of voltage yield (mV) as a function of salt bridge component concentrations (g/100 ml) and initial pH based on the central composite design results.
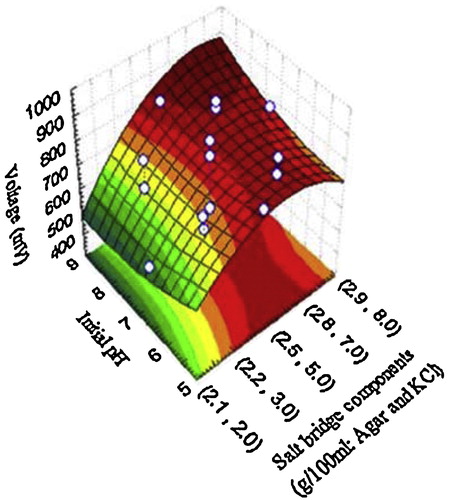
Fig. 5 The relationship between the response (voltage yield) and the different independent variables, showing the predicted optimal values based on the central composite design results.
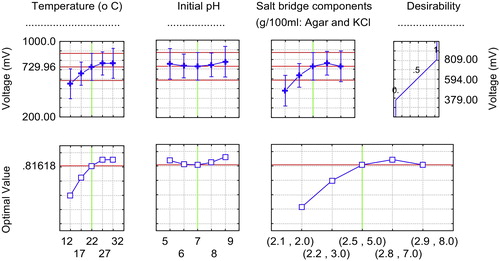
Table 3 Observed responses of three independent variables: temperature, initial anodic compartment pH, and salt bridge component concentrations (agar and KCl).
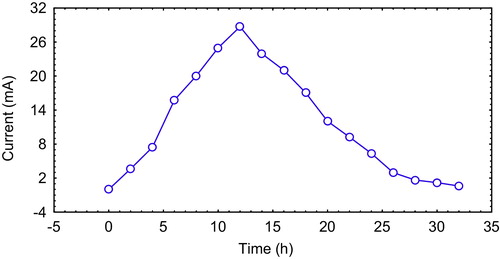
Fig. 6 Current vs. time curve of a typical batch operation.