Figures & data
Table 1 Face-centred central composite design matrix with the experimental and predicted responses for lipase production.
Fig. 1 Effects of different concentrations of Tween-80, olive oil and sucrose (0.2–1.2%) on lipase activity by A. niger using SNC as the main substrate.
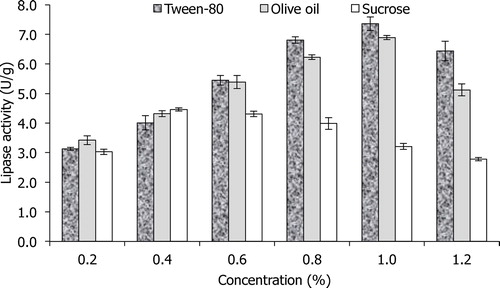
Fig. 2 Effects of different concentrations of (NH4)2SO4 and Na2HPO4 (0.1–0.6%) on lipase activity by A. niger using SNC as the main substrate.
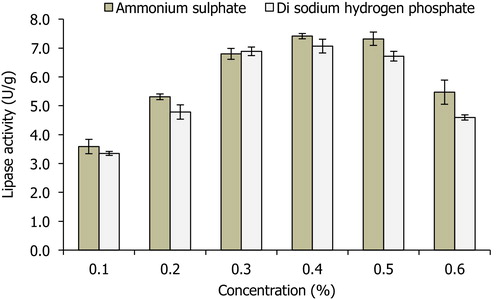
Fig. 3 Effects of different concentrations of MgSO4 (0.05–0.20%) on lipase activity by A. niger using SNC as the main substrate.
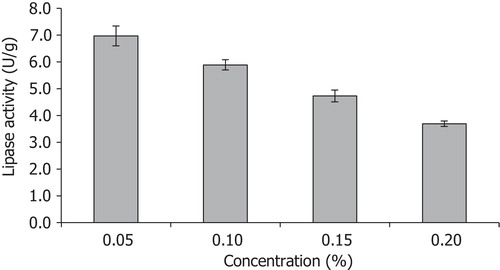
Table 2 ANOVA of the quadratic model developed for the optimization of lipase production.
Fig. 4 Plots showing the effects of Tween-80 and (NH4)2SO4 at a fixed concentration of Na2HPO4 on lipase production by A. niger using SNC as the main substrate. (a) Response surface 3D and (b) contour plot (2D).
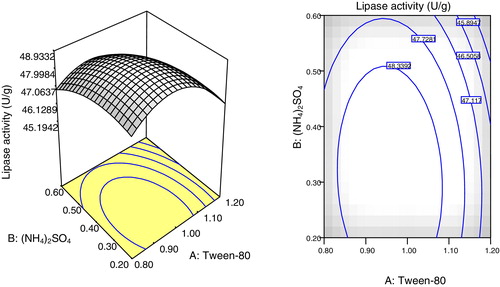
Fig. 5 Plots showing the effects of Tween-80 and Na2HPO4 at a fixed concentration of (NH4)2SO4 on lipase production by A. niger using SNC as the main substrate. (a) Response surface 3D and (b) contour plot (2D).
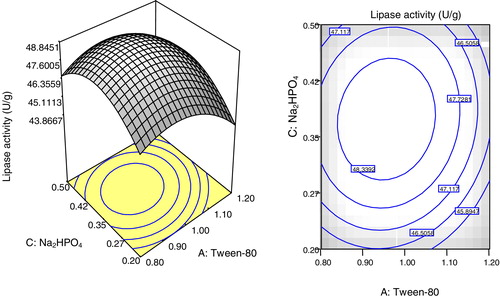
Fig. 6 Plots showing the effects of Na2HPO4 and (NH4)2SO4 at a fixed concentration of Tween-80 on lipase production by A. niger using SNC as the main substrate. (a) Response surface 3D and (b) contour plot (2D).
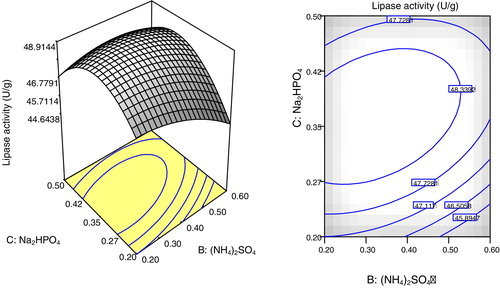
Table 3 Validation of the experimental model.
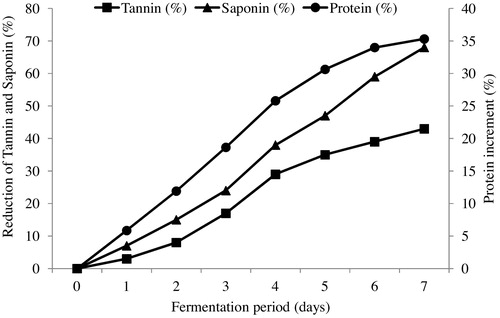
Fig. 7 Reductions in tannin and saponin concentrations (%) and an increase of protein concentration (%) with time during the bioconversion of SNC for lipase production by A. niger.