
Figures & data
Fig. 1 Chemical structure of the studied antifungal drugs.
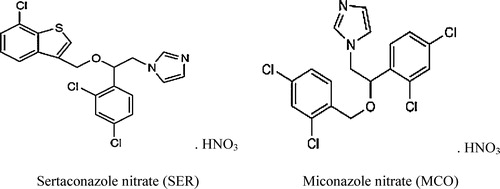
Fig. 2 Absorption spectra of the ion-pair complexes of 10 and 16 μg mL−1 SER and MCO with 1.0 × 10⁻³ mol L−1 BCP reagent against a reagent blank.
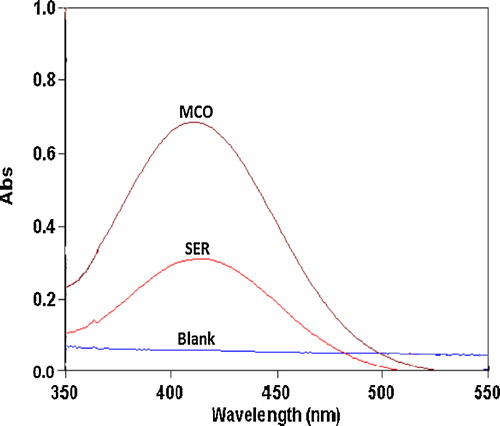
Fig. 3 Absorption spectra of the ion-pair complexes of 14 and 18 μg mL−1 SER and MCO with 1.0 × 10⁻³ mol L−1 BPB reagent against the reagent blank.
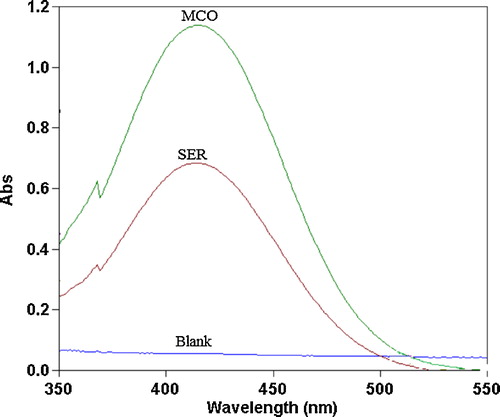
Fig. 4 Absorption spectra of ion-pair complexes of 20 and 24 μg mL−1 SER and MCO with 1.0 × 10⁻³ mol L−1 MO reagent against reagent blank.
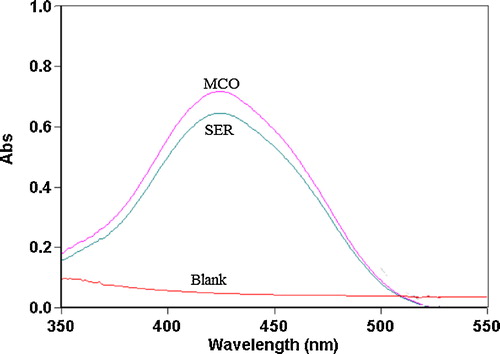
Fig. 5 Effect of the pH of the acetate buffer solution on ion-pair complex formation between 14 μg mL−1 SER and BCP, BPB and MO reagents (1.0 × 10⁻³ mol L−1).
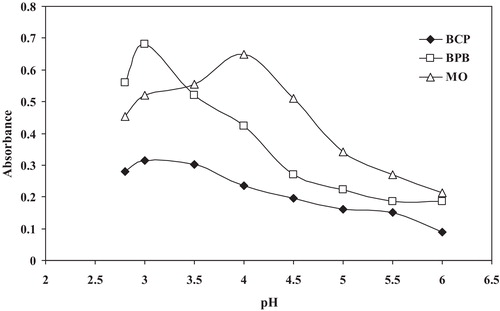
Fig. 6 Effect of the volume of the BCP, BPB and MO reagents (1.0 × 10⁻³ mol L−1) on ion-pair complex formation with 14 μg mL−1 MCO.
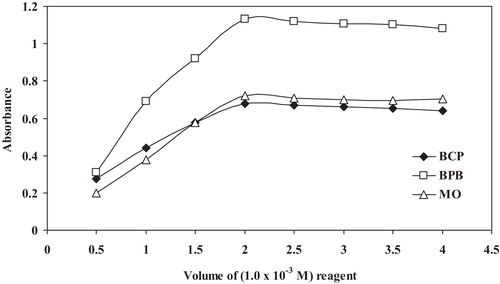
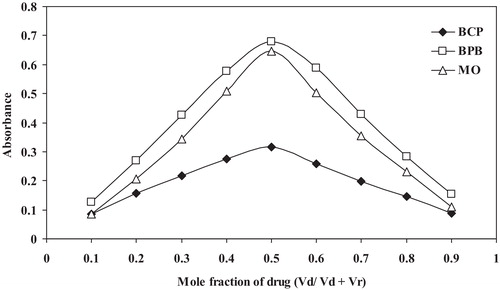
Fig. 7 Job’s method of continuous variation plot for the reaction of SER with dyes: BCP, BPB and MO, [drug] = [dye] = 5.0 × 10⁻⁴ mol L−1.
Scheme 1 Proposed reaction mechanism for the ion-pair complex formation between SER and BPB.
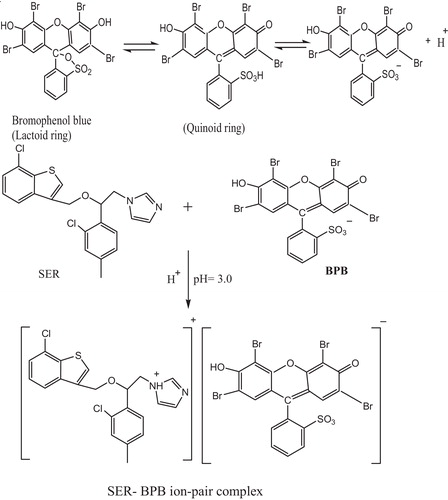
Table 1 Statistical analysis of the calibration graphs and analytical data in the determination of SER and MCO using the proposed methods.
Table 2 Intra-day and inter-day precision and accuracy data for SER obtained using the proposed methods.
Table 3 Intra-day and inter-day precision and accuracy data for MCO obtained using the proposed methods.
Table 4 Application of the standard addition technique for the determination of SER and MCO in dosage forms using the proposed methods.