
Figures & data
Table 1 Structures and activity of pyrazole-4-carboxamide derivatives as anticancer agents.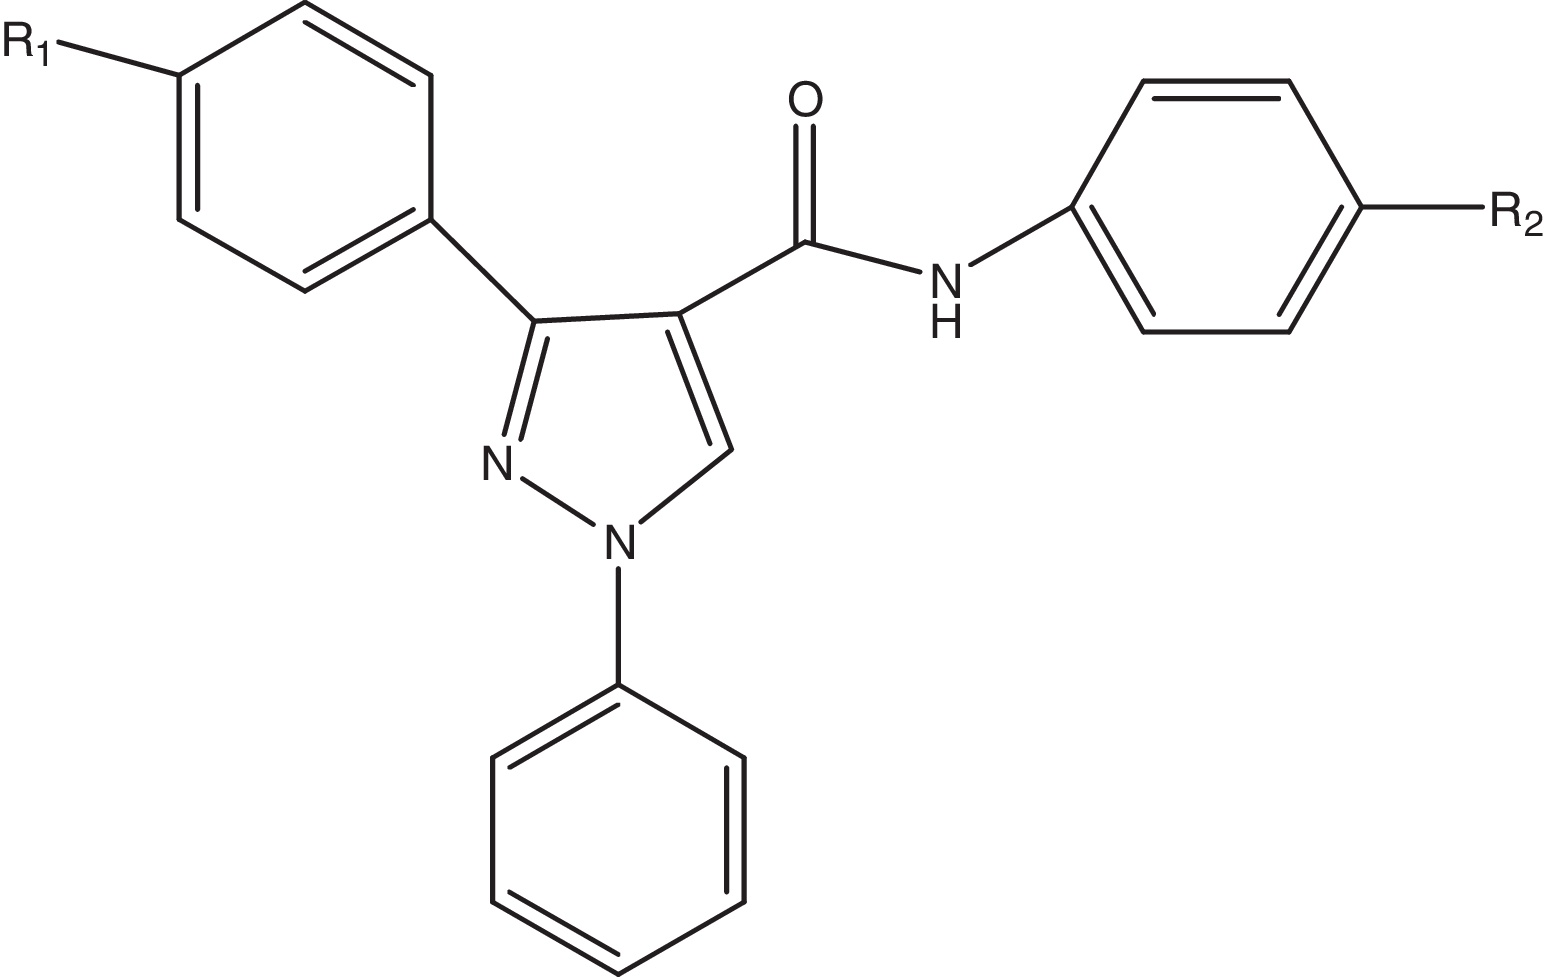 .
.
Table 2 Correlation matrix between descriptors present in the best QSAR model-1(HCT116-cell-lines).
Fig. 1 (a) Contribution charts of the descriptors for the 2D model-1. (b) Plot of observed versus predicted activity by best 2D QSAR model 1. (c) Contribution charts of the descriptors for the 2D model-2. (d) Plot of observed versus predicted activity by best 2D QSAR model 2. (e) Contribution charts of the descriptors for the 2D model-3. (f) Plot of observed versus predicted activity by best 2D QSAR model 3. (g) Contribution charts of the descriptors for the 2D model-4. (h) Plot of observed versus predicted activity by best 2D QSAR model-4. (i) The designed scaffold new chemical entity.
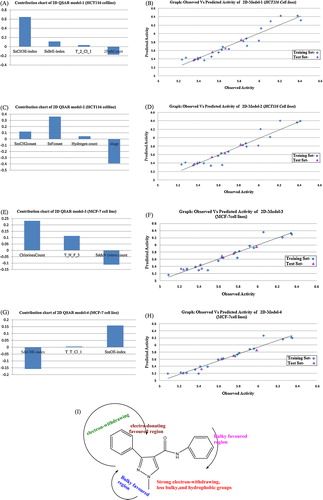
Table 4 Comparative observed and predicted activities of carboxamide derivatives.
Table 3 Correlation matrix between descriptors present in the QSAR model-3(MCF-7-cell-lines).