
Figures & data
Fig. 1 Chemical structure of the studied compounds.
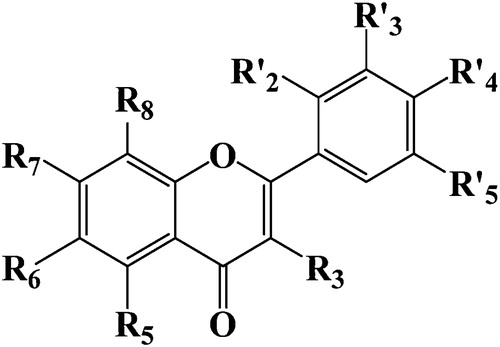
Table 1 Observed activity of studied flavonoids derivatives.
Table 2 Values of the obtained parameters of the studied substituted flavonoids.
Table 3 Correlation matrix between different obtained descriptors.
Fig. 2 Graphical representation of calculated and observed activity and the residues values calculated by MLR.
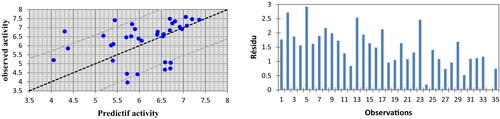
Fig. 3 Graphical representation of calculated and observed activity and the residues values calculated by MNLR.
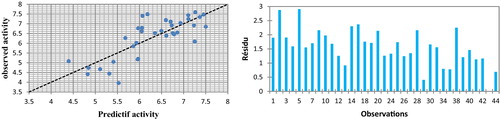
Fig. 4 Graphical representation of calculated and observed activity and the residues values calculated by ANN.
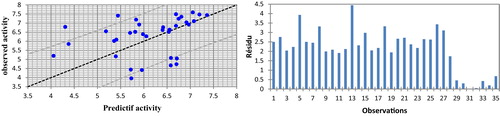
Table 4 Performance comparison between models obtained by MLR, RNLM and ANN.
Table 5 Observed values and calculated values of pIC50 according to different methods.
Table 6 Results of test sets generated.