
Figures & data
Fig. 1 The study area map both the VES location, the geologic rock types map with inset map of Nigeria.
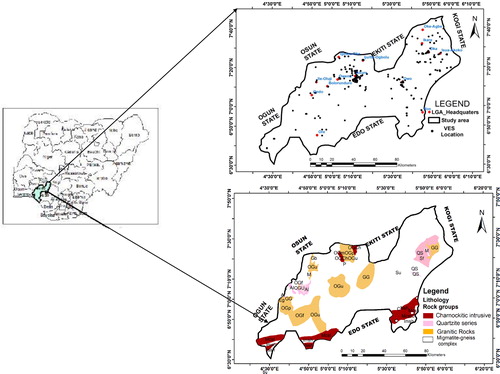
Fig. 2 The flowchart of the adopted methodology for the study.
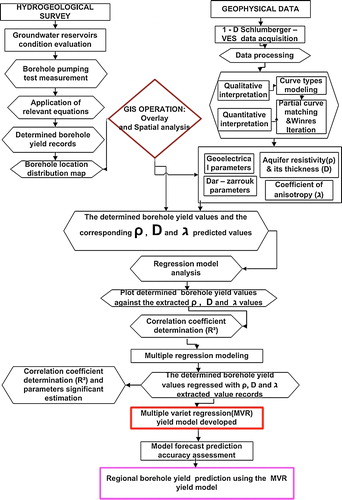
Fig. 3 The borehole distribution inventory map of the area.
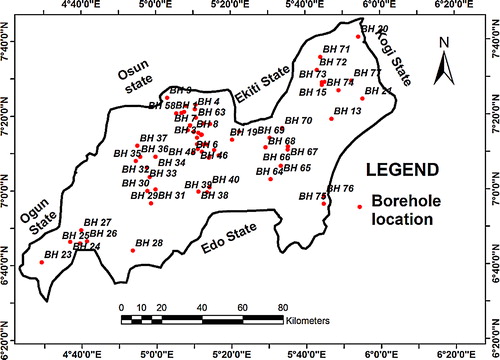
Table 1 Borehole yield rating inventory records of the area.
Fig. 4 Typical resistivity model curves obtained in the area.
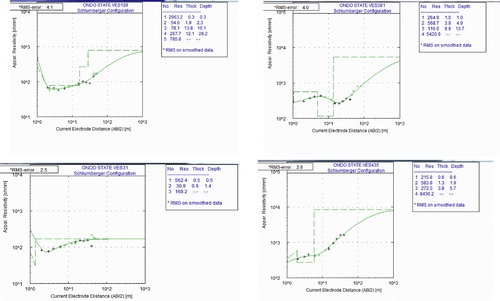
Fig. 5 Borehole yield conditioning factors used in developing the multi-variate regression yield model where (a) aquifer resistivity map, (b) aquifer thickness map and (c) coefficient of anisotropy map.
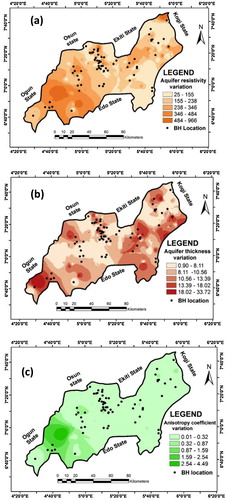
Table 2 Summary of the interpreted geoelectric parameters.
Fig. 6 Linear relationship between the borehole yield rate records and the geoelectrical derived parameters where graphs (a)–(c) are resistivity, thickness and coefficient of anisotropy parameters models, respectively.
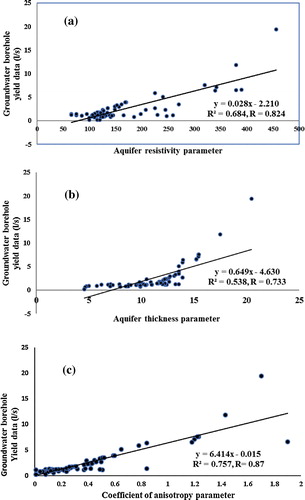
Table 3 Results of the geoelectric parameters and the corresponding actual borehole yield values.
Table 4 Parameters estimations analysis of the developed multiple variate regression (MVR) yield model developed in the area.
Fig. 7 Linear relation between the actual borehole yield rate and the estimated borehole yield rate based on the MVR prediction yield model.
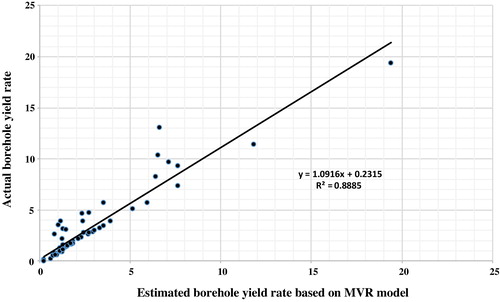
Table 5 The records of the actual borehole yield determined and the predicted borehole yield in the area.
Table 6 MVR yield model prediction accuracy analysis.
Fig. 8 The borehole yield rate prediction model map based on the MVR borehole yield model developed.
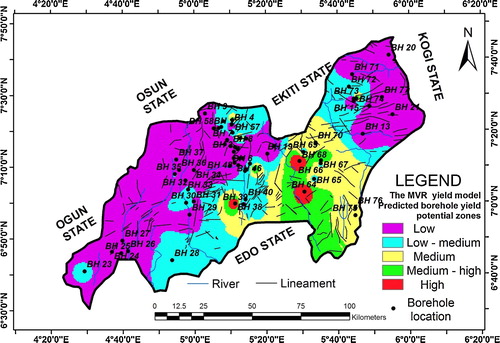
Table 7 The GIS based cross-tabulation analysis results for the model map validation.