Figures & data
Fig. 1 The effect of the antibacterial substances produced by the eight isolates against the indicator organisms.
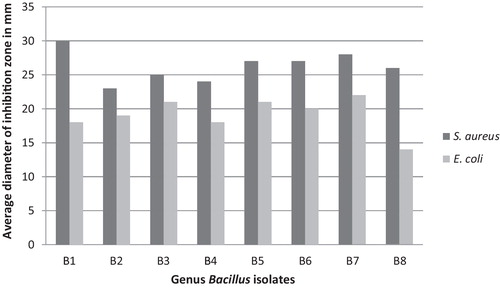
Fig. 2 PCR amplification of the 16S rRNA gene from the eight microbially active isolates showing a single gene fragment in the range of 1.5 kb. Lane M: standard DNA molecular weight marker (1 kb plus DNA ladder), Lanes B1 to B8, the eight isolates.
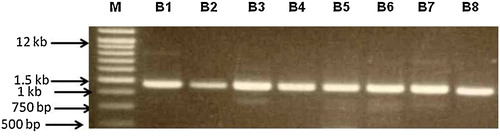
Fig. 3 Likelihood phylogenetic tree based on the nucleotide sequences of the 16S rRNA gene, depicting the phylogenetic relationship between the eight isolates and other representatives of the Bacillus genera. All sequences were aligned on Streptomyces griseus (GenBank accession D63872.1). The tree was drawn to scale, with branch lengths measured in the number of substitutions per site. Bootstrap values from 500 replicates.
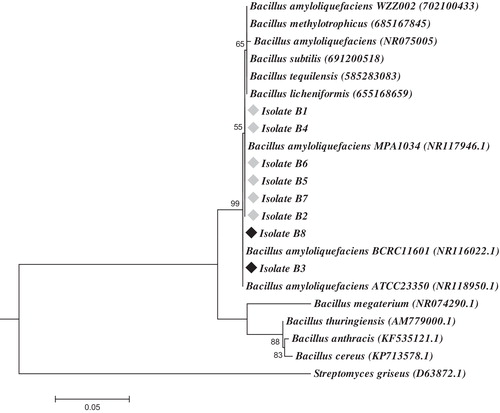
Table 1 BLAST search results of the studied isolates with the first species on the NCBI including their sequences accession numbers and similarities.
Fig. 4 The effect of enzymatic digestion on the antibacterial activity.
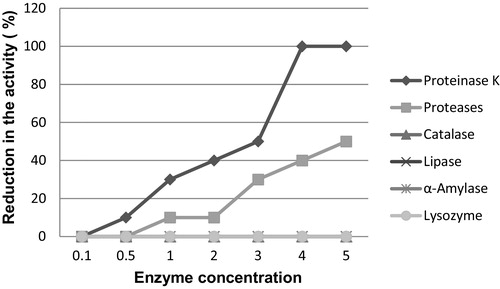
Fig. 5 Effect of incubation time on inhibitory activity of the antibacterial compound shown against Staphylococcus aureus, with the increase in bacterial cell number measured at OD 600 nm.
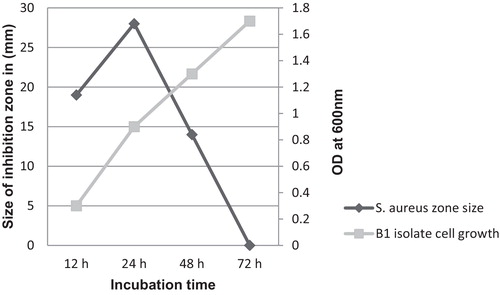
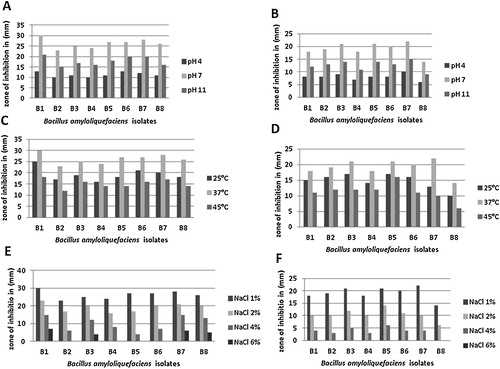
Fig. 6 The effect of different physiological factors on the antibacterial activity of Bacillus amyloliquefaciens cell-free culture supernatant tested against Staphylococcus aureus (panels A, C and E) and Escherichia coli (panels B, D and F).