
Figures & data
Table 1 Observed activities of studied phenethylamines.
Fig. 1 The chemical structure of the studied compounds.
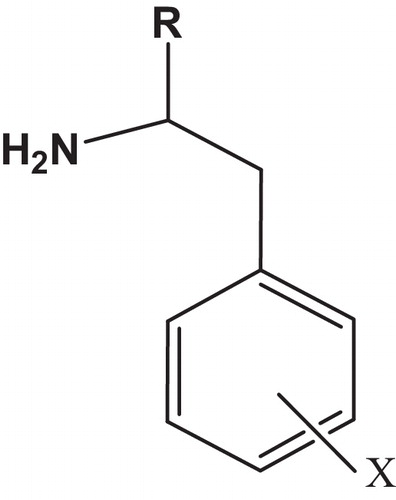
Table 2 The values of Molecular descriptors used in QSAR study.
Fig. 2 The principal components and their variances.
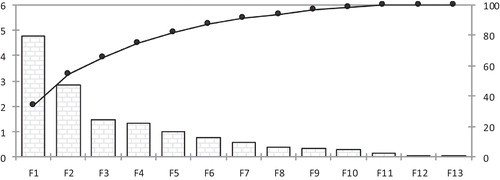
Table 3 Correlation matrix between different obtained descriptors.
Table 4 Multicolinearity test.
Fig. 3 Graphical representation of calculated and observed activity (log UM) values calculated by MLR model.
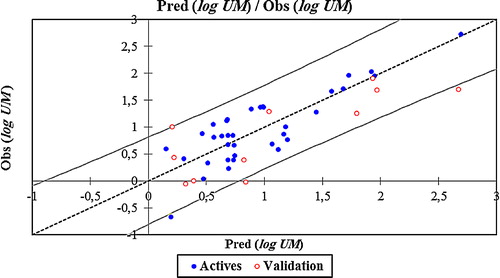
Fig. 4 Graphical representation of calculated and observed activity (log UM) values calculated by MNLR model.
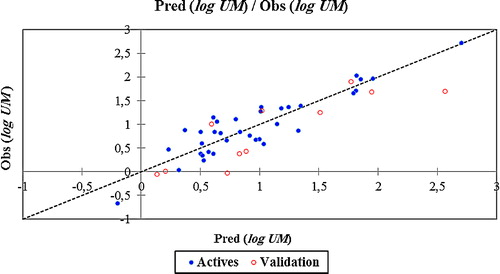
Fig. 5 Williams plot for the training set and external validation for the psychotomimetic activity of phenethylamines compounds, listed in (h* = 0.51 and residual limits ±2).
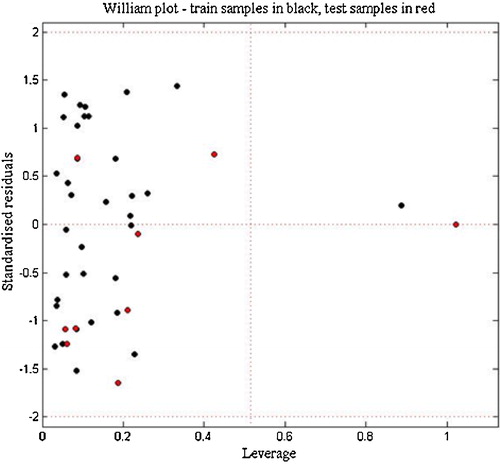
Table 5 the statistical results of MLR and MNLR models with validation techniques.
Table 6 Observed values and calculated values of log UM according to different methods.