
Figures & data
Fig. 1 Absorption spectra of the MTB method: (A) Reaction product of ETM (15 μg/ml) with F–C reagent in Na2CO3 solution; (B) the blank.
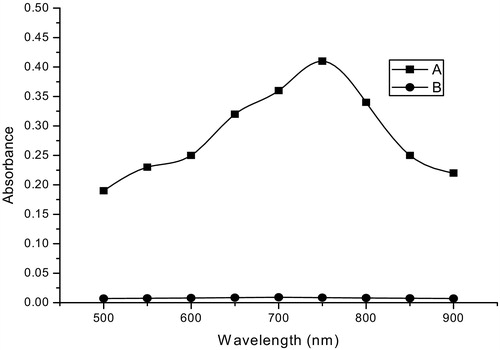
Fig. 2 Absorption spectra of PB method: (A) Reaction product of ETM (2 μg/ml) with iron(III) and ferricyanide in HCl medium; (B) the corresponding blank.
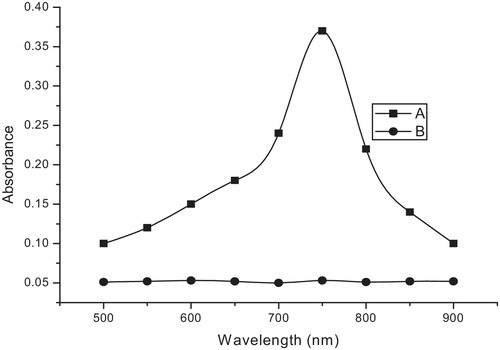
Fig. 3 Possible reaction pathways yielding coloured species.
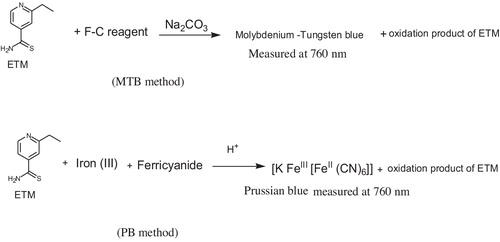
Fig. 4 (a) Effect of the F–C reagent concentration (ETM, 15 μg/ml). (b) Effect of 20% Na2CO3 (ETM, 15 μg/ml).
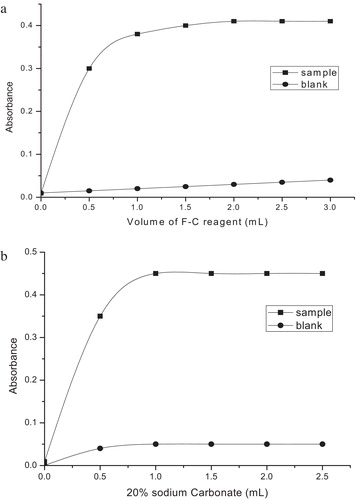
Fig. 5 (a) Effect of the iron(III) concentration (ETM, 2.0 μg/ml). (b) Effect of the potassium ferricyanide concentration (ETM, 2.0 μg/ml). (c) Effect of the HCl concentration (ETM, 2.0 μg/ml).
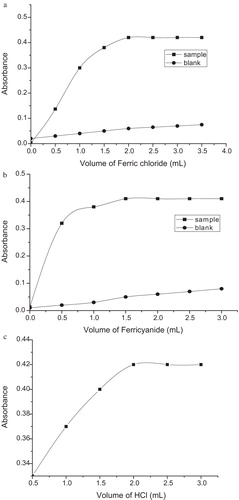
Fig. 6 (a) Calibration curve for the Molybdenum-tungsten blue method. (b) Calibration curve for the Prussian blue method.
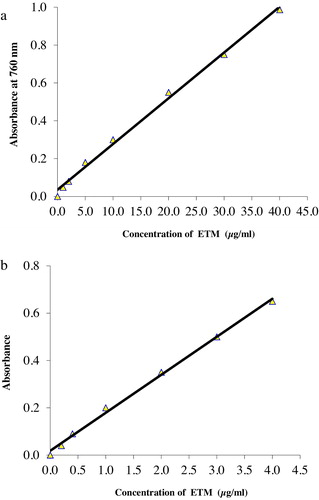
Table 1 Sensitivity and regression parameters.
Table 2 Evaluation of intra-day and inter-day accuracy and precision.
Table 3 Method robustness and ruggedness expressed as intermediate precision (% RSD).
Table 4 Results of analysis of tablets by the proposed methods and statistical comparison of the results with the official method.
Table 5 Results of recovery experiment through standard-addition method.
Table 6 Comparison of the proposed and the existing spectrophotometric methods.