Figures & data
Fig. 1 Chemical structure of clotrimazole.
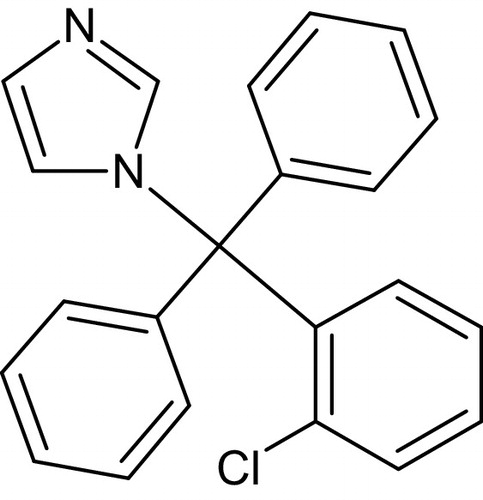
Table 4 Characteristic peaks of the CLZ and the π-acceptors.
Table 5 Infrared frequenciesTable Footnotea (cm−1) and their band assignmentsTable Footnoteb for the CLZ, free acceptors, and CLZ-TCE and CLZ-TCNQ complexes.
Fig. 2 Absorption spectra of (a) CLZ (1000 μg mL−1), (b) CLZ-TCE (35 μg mL−1) and (c) CLZ-TCNQ (25 μg mL−1).
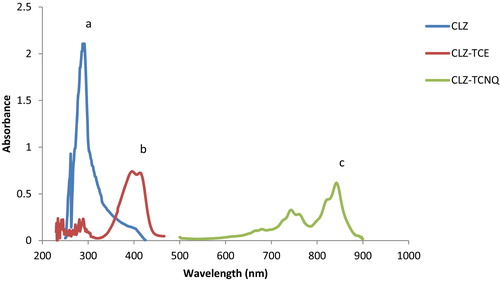
Fig. 3 Probable reaction mechanisms for the formation of the CLZ-TCE and CLZ-TCNQ complexes.
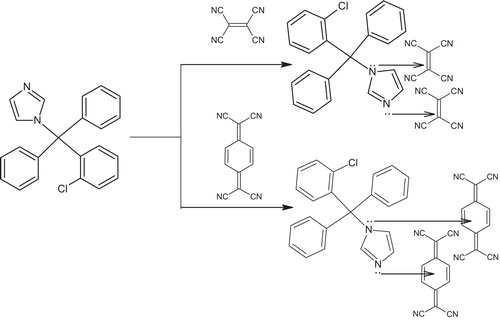
Fig. 4 Effect of solvent on the reaction of CLZ with TCE and TCNQ.
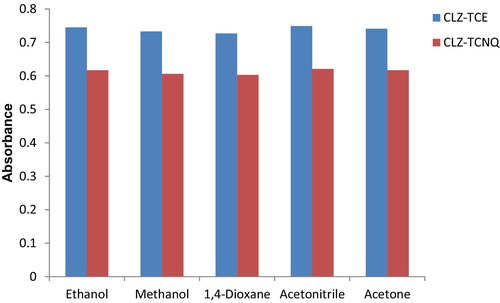
Fig. 5 Continuous variation plots for the CLZ-TCE and CLZ-TCNQ complexes.
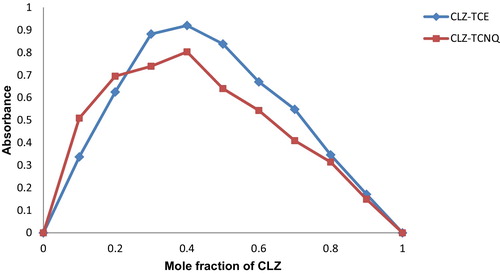
Fig. 6 Calibration plot for the analysis of the CLZ by the proposed methods.
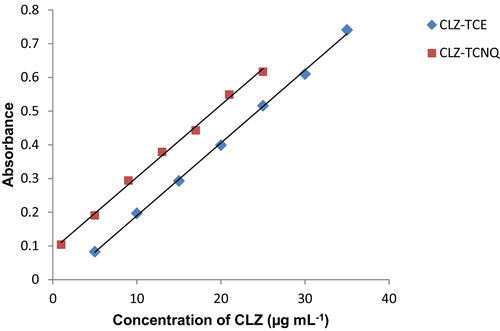
Table 1 Spectral data for the analysis of CLZ with the TCE and TCNQ acceptors.
Table 2 Evaluation of the accuracies and precisions of the proposed methods.
Table 3 Statistical results from the analysis of the formulations using the proposed methods.
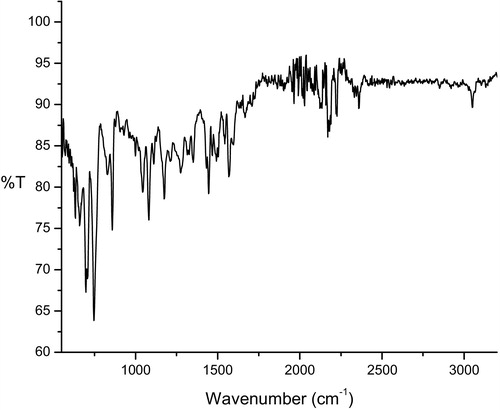
Fig. 7 Infrared spectra of CLZ-TCE.
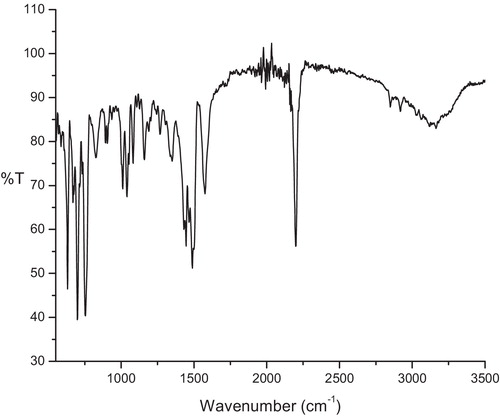
Fig. 8 Infrared spectra of CLZ-TCNQ.