
Figures & data
Fig. 1 Planar intramolecular H-bonded optimized structure of H2IF.
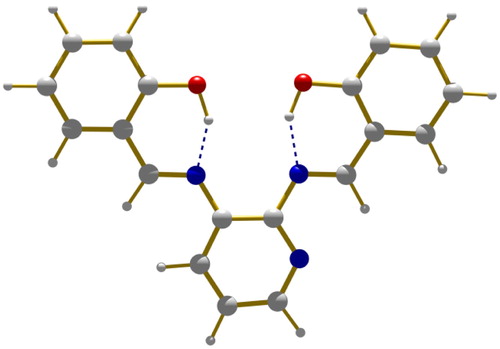
Fig. 2 Absorption spectra of H2IF (blue) and H2IF-copper(II) complex (red).
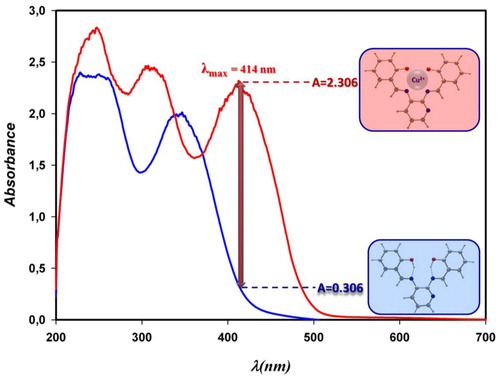
Fig. 3 Dependence of the absorbance of H2IF-copper(II) complex on pH.
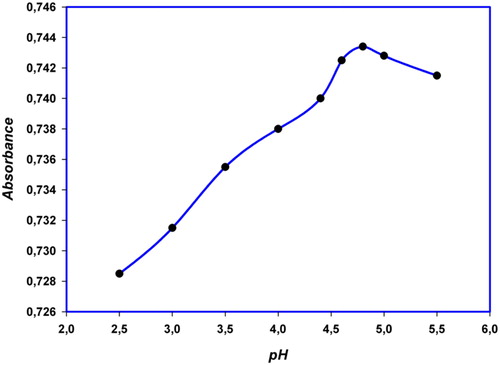
Fig. 4 Calibration curve for spectrophotometric determination of copper(II).
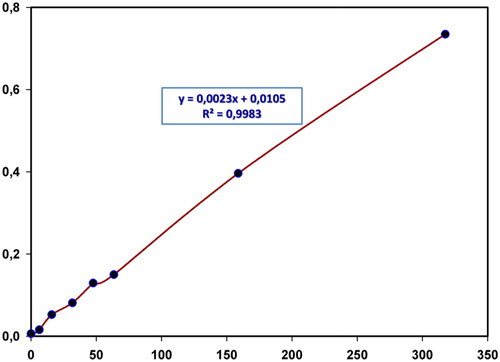
Table 1 Analytical results of water samples and the recovery of spiked analyte, and standard reference materials.
Fig. 5 Job’s plot for the mixtures of H2IF and Cu(II) solutions maximized at an approximately 1:1 metal to ligand ratio.
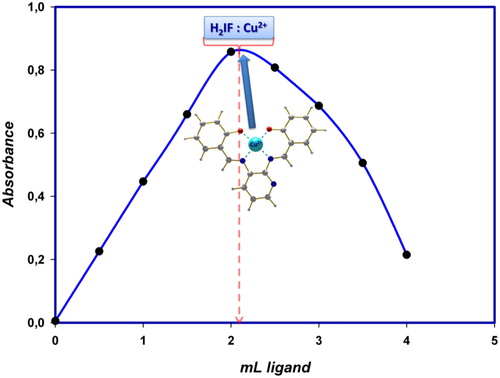
Table 2 Comparison of the present spectrophotometric data to others in the determination of copper(II).