Figures & data
Table 1 The six levels of genetic detail in crop simulation models [Citation3].
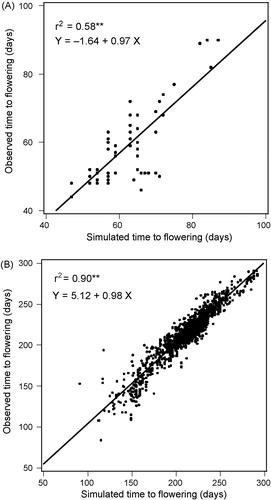
Table 2 Comparisons of results for conventional and gene-based simulation models of time to flower for 10 sorghum lines [Citation8] and 29 wheat cultivars [Citation15]. Evaluation datasets are independent from calibration sets, predominantly involving different locations. The variation that was explained by assuming no differences among cultivars was tested by evaluating simulations based on parameters for a single generic cultivar.