448
Views
21
CrossRef citations to date
0
Altmetric
Original Article

Rate of leaf expansion: A criterion for identifying oil palm (Elaeis guineensis Jacq.) types suitable for planting at high densities

Pages 141-147 | Received 01 Sep 2008, Accepted 10 Mar 2010, Published online: 18 Jun 2021

Figures & data

Fig. 1 Total dry matter, vegetative dry matter and bunch dry matter production in relation to leaf area index. The curves for total dry matter and vegetative dry matter were fitted through subplot values of the 56, 110, 148 and 186 palms per ha treatments from a plant density experiment in Papua New Guinea [Citation7]. Data were assembled over a period of 6–9 years after planting. Maximum bunch dry matter production, as indicated on the y-axis, is reached at LAI = 5.6.
Fig. 2 Area of the first fully expanded youngest leaf in relation to number of years after planting for Ekona, Nigeria, and Calabar during the three phases of canopy expansion. The vertical arrows indicate t0.95 values (time to reach 95% of Lmax).

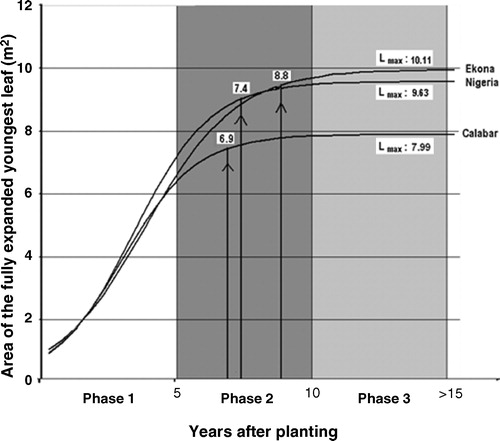
Table 1 Mean maximum leaf area (Lmax) of the Ekona, Nigeria and Calabar origins planted at 135 palms per ha, along with the 95% confidence interval and level of statistical significance (p-value) of differences between origins.

Table 2 Mean leaf area (m2) of the Ekona, Nigeria and Calabar origins planted at 135 palms per ha, over the first 8 years after planting, along with the level of statistical significance (p-value) of differences between origins.

Fig. 3 Leaf area index of Ekona (
), Nigeria (
) and Calabar (
) estimated for a density of 143 palms per ha, and Calabar (
) estimated for a density of 160 palms per ha, during the three phases of canopy expansion. The range of optimal LAI values is marked.

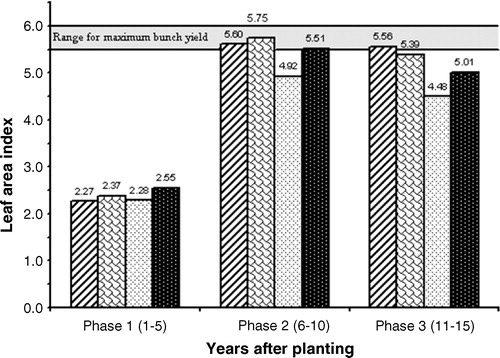
Table 3 Mean leaf area index (LAI) and 95% confidence Intervals of the means, during the three phases of canopy expansion, estimated for the origins Ekona, Nigeria and Calabar planted at a density of 143 palms per ha, and for Calabar* planted at 160 palms per ha.

Table 4 Differences in leaf area index (LAI) of the origins Ekona and Nigeria vs. Calabar estimated for a density of 143 palms per ha, and vs. Calabar* estimated for 160 palms per ha, along with the level of statistical significance (p-value), during the three phases of canopy expansion.

Fig. 4 Calculated percentage light interception by the canopies of Ekona (
) and Nigeria (
) estimated for a density of 143 palms per ha, and of Calabar (
) estimated for a density of 160 palms per ha, during the three phases of canopy expansion. Canopy closure is at 80% light interception [Citation7].

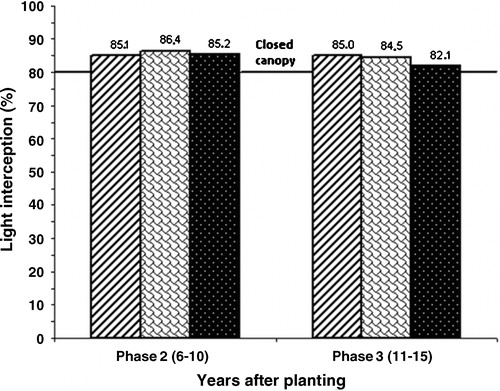
Table 5 Differences in percentage light interception between the origins Nigeria and Ekona, both estimated for 143 palms per ha, and of Ekona and Nigeria vs. Calabar* estimated for 160 palms per ha, along with the level of statistical significance (p-value), during Phases 2 and 3 of canopy expansion.

Fig. 5 General Combining Ability (GCA) values for bunch yield (kg per palm per year) vs. GCA values for Lmax of six Nigeria pisifera palms (N1–N6). Lmax values are given in parentheses.

Reprints and Corporate Permissions

Please note: Selecting permissions does not provide access to the full text of the article, please see our help page How do I view content?

To request a reprint or corporate permissions for this article, please click on the relevant link below:

Academic Permissions

Please note: Selecting permissions does not provide access to the full text of the article, please see our help page How do I view content?

Obtain permissions instantly via Rightslink by clicking on the button below:

If you are unable to obtain permissions via Rightslink, please complete and submit this Permissions form. For more information, please visit our Permissions help page.