Figures & data
![](/cms/asset/99bc21f6-7497-45a3-8524-c8912f54720b/tjls_a_12128466_f0001_ob.jpg)
Table 1 Description of variables used for farm typology construction.
![](/cms/asset/672bea45-86ae-4f70-afd8-e25ecc96e996/tjls_a_12128466_f0002_ob.jpg)
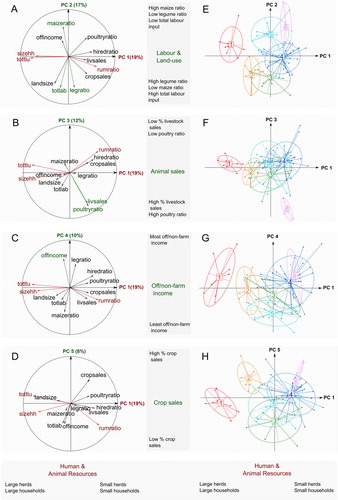
Table 2 Eigenvalues and percentage variance explained by five principal components (PCs) using PCA.
![](/cms/asset/e2cc9834-0bbb-4258-a5c5-748d8fd5be64/tjls_a_12128466_f0003_ob.jpg)
![](/cms/asset/fa84b9dd-65c8-4893-bcfb-a8c6fdd068ca/tjls_a_12128466_f0004_ob.jpg)
![](/cms/asset/f45e41b9-92fd-4f90-90d6-70c76963ec64/tjls_a_12128466_f0005_ob.jpg)
Table 3 Main implications of the farm typology for targeting of agricultural interventions in Savelugu-Nanton and Tolon-Kumbungu districts of Ghanas Northern Region.
![](/cms/asset/a2a8d197-001d-4130-b534-d8f703723e81/tjls_a_12128466_f0006_ob.jpg)