857
Views
22
CrossRef citations to date
0
Altmetric
Research paper

Supporting local institutions for inclusive green growth: Developing an Evidence Gap Map

, , &
Pages 51-71 | Received 05 Dec 2016, Accepted 06 Oct 2017, Published online: 18 Jun 2021

Figures & data

Fig. 1 Theory of change.
Fig. 2 Summary of the structured search procedure.

Table A1 Keywords used in structured literature search.

Table A2 databases used in structured literature search.

Table A3 Examples of search strings applied.

Table A4 Aggregation of interventions into eight distinct categories.

Table A5 Intermediate outcome indicators.

Table A6 Final outcome indicators.

Fig. 3 Evidence Gap Map.

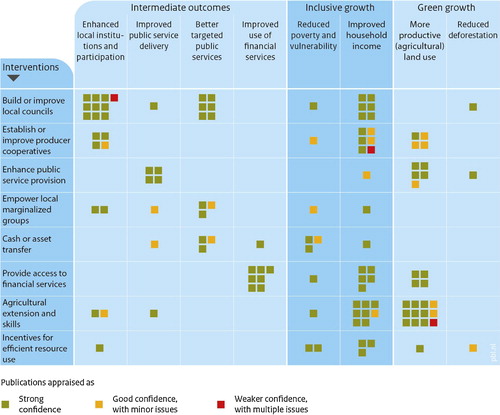
Fig. 4 Studies reporting final outcomes1.

1The total number of studies displayed in exceeds fourteen since some studies evaluate multiple combinations of intermediate and final outcomes. The outcome indicators result from different interventions, information on which has been suppressed in this figure for clarity

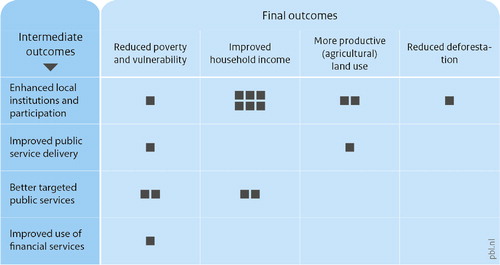
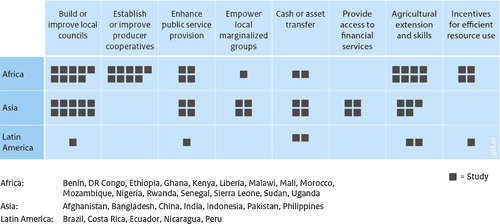
Fig. 5 Distribution of interventions evaluated across continents1.

1The total number of studies displayed in exceeds the overall number of 66 studies identified since some studies evaluate multiple interventions, or combinations thereof.

Reprints and Corporate Permissions

Please note: Selecting permissions does not provide access to the full text of the article, please see our help page How do I view content?

To request a reprint or corporate permissions for this article, please click on the relevant link below:

Academic Permissions

Please note: Selecting permissions does not provide access to the full text of the article, please see our help page How do I view content?

Obtain permissions instantly via Rightslink by clicking on the button below:

If you are unable to obtain permissions via Rightslink, please complete and submit this Permissions form. For more information, please visit our Permissions help page.