Figures & data
Table 1 European Union databases from which the projects for review were sourced.
Table 2 Overview of the 200 reviewed co-innovation partnerships.
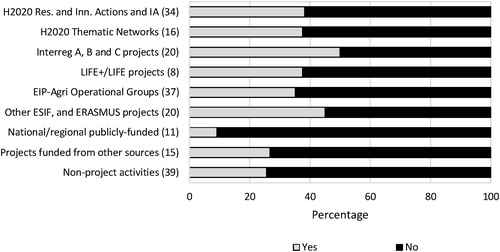
Fig. 1 Percentage of partnerships with a link to other projects or initiatives, by type.
Note: in all Figures, the numbers of each partnership type are shown in parentheses.
Source: own data.
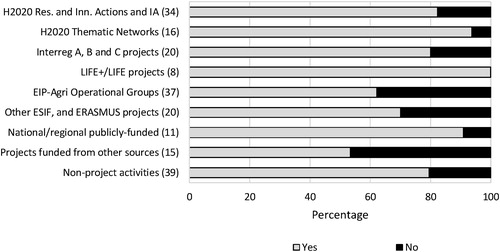
Fig. 2 Interviewees’ perceptions of whether, with hindsight, any relevant actors were excluded from the partnership, by type.
Source: own data.
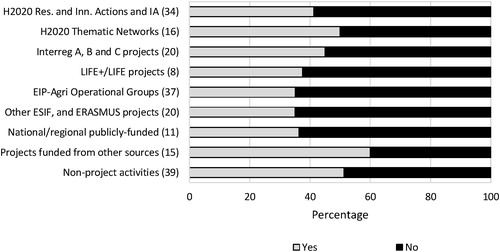
Fig. 3 Extent to which some or all partners were involved in setting and defining the project targets and objectives, by type.
Source: own data.
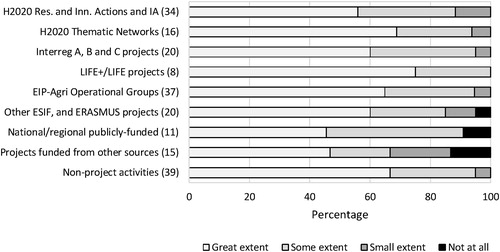
Fig. 4 Effectiveness of the mechanisms applied to stimulate information and knowledge exchange within the partnership, by type.
Source: own data.
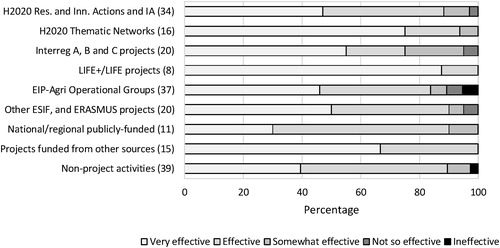
Fig. 5 Importance attached by the partnership to external communication, by type.
Source: own data.
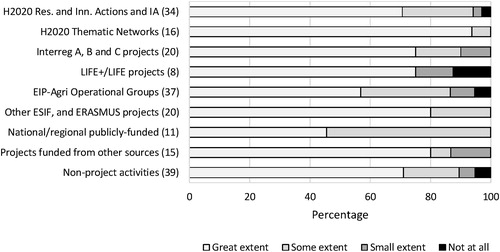
Fig. 6 Interviewees’ self-evaluation of the (potential) success of the partnership in terms of communication/outreach, by type (10 = ‘very high’; 1 = ‘very low’).
Source: own data.
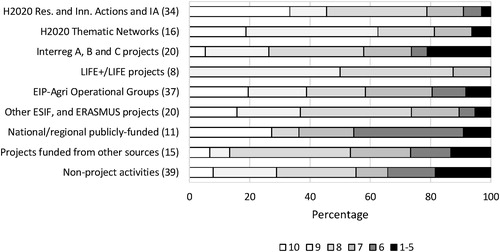
Fig. 7 Interviewees’ perceptions of whether the right information was available to the partnership to bring their co-innovation activity to a successful conclusion, by type.
Source: own data.
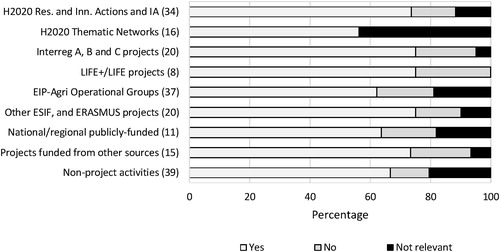
Fig. 8 Use of an innovation broker by the partnership during the proposal writing process, by type.
Source: own data.