Figures & data
Fig. 9 B-scan representation in the case of 60 degree orientation at (a) 5 cm depth and (b) 15 cm depth.
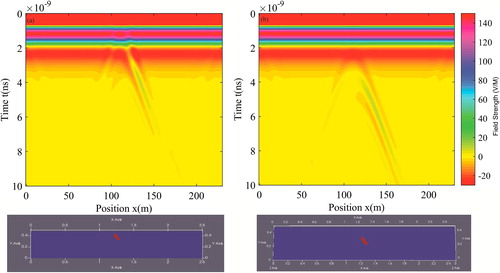
Fig. 10 B-scan representation in the case of 90 degree orientation at (a) 5 cm depth and (b) 15 cm depth.
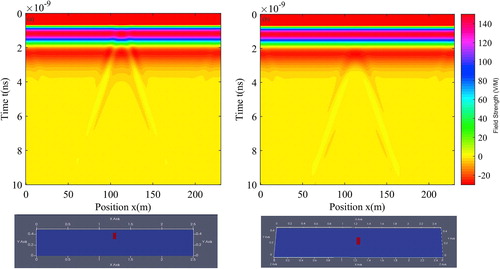
Fig. 11 B-scan representation in the case of 250 degree orientation at (a) 5 cm depth and (b) 15 cm depth.
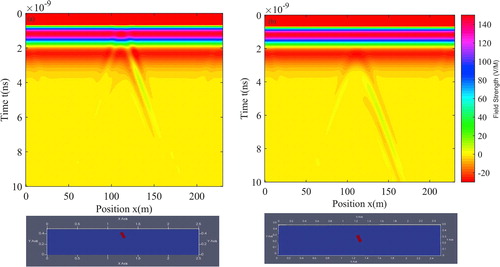
Table 1 Set-up configurations of landmine models detection experiment.
Fig. 1 The buried PMN-2 and type 72 mines.
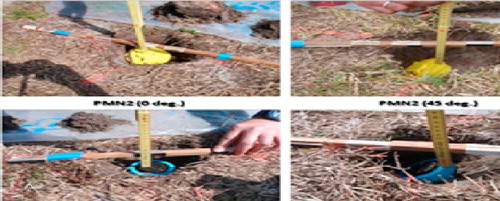
Fig. 2 B-Scan (2D) GPR image of the buried landmine models at 5 cm depth.
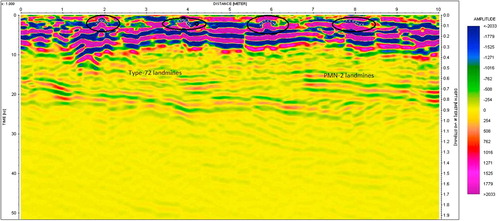
Table 2 Landmines (PMN-2 and type 72) specifications.
Fig. 3 Simulation image of the buried landmine models at 5 cm depth.
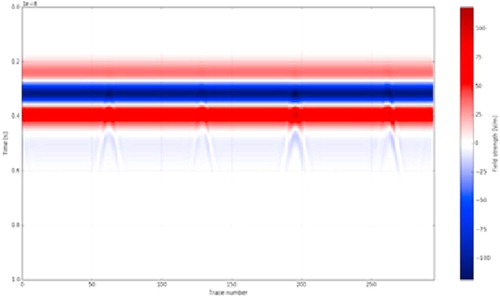
Table 3 Simulation parameters of plane wave models.
Fig. 4 Different positions of PMN-2 at two depths 5 cm and 15 cm.
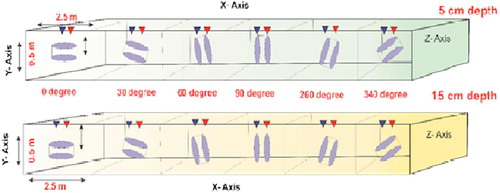
Fig. 5 A-scan representation for all orientations at 5 cm depth. (b) A-scan is focused on the change in the crest and trough.
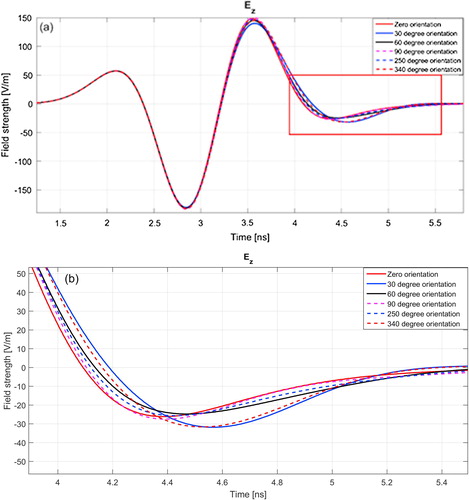
Fig. 6 A-scan representation for all orientations at 15 cm depth. (b) A-scan is focused on the change in the crest and trough.
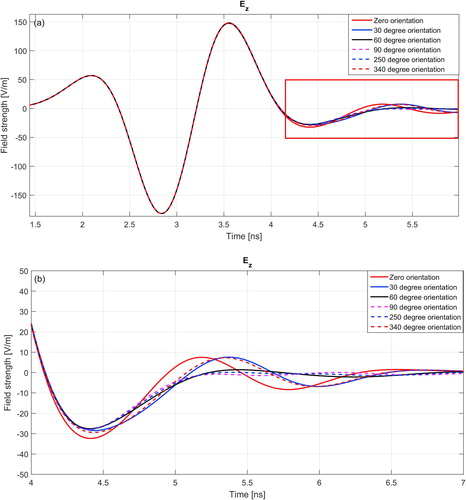
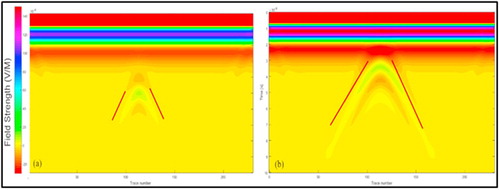
Fig. 7 B-scan representation in the case of zero degree orientation at (a) 5 cm depth and (b) 15 cm depth.
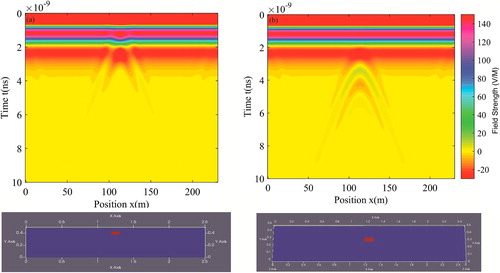
Fig. 8 B-scan representation in the case of 30 degree orientation at (a) 5 cm depth and (b) 15 cm depth.
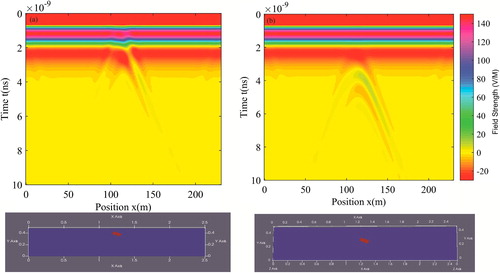
Fig. 12 B-scan representation in the case of 340 degree orientation at (a) 5 cm depth and (b) 15 cm depth.
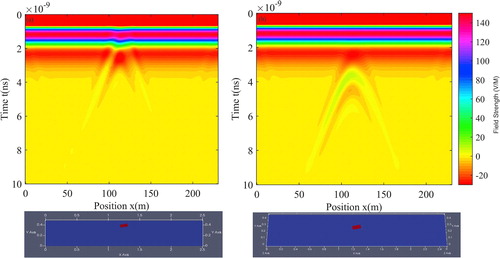
Fig. 13 Sinai geological map.
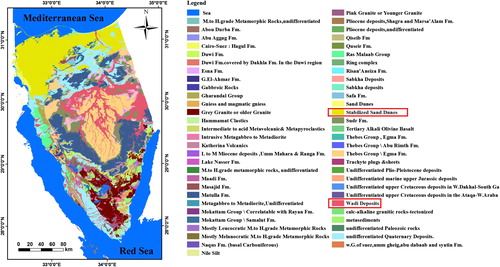
Fig. 14 B-scan representation in the case of different soil parameters (a) Wadi deposit and (b) Sand dunes.