Figures & data
Fig. 1 Location map of Lake Nasser showing the distributions of earthquake epicentral (blue dotes), locations of VES measured stations (red squares) and gravity profiles used for 2D modeling (black lines).
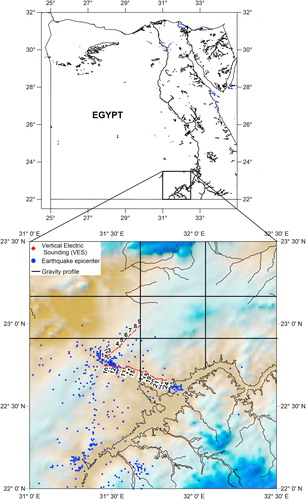
Table 1 List of earthquake events in/around Lake Nasser, collected from Aswan, Abu–Simbil, Marsa Alam seismic stations, Aswan seismic network and Egyptian National Seismic Network during 1982–2014.
Fig. 2 The geologic map of the Lake Nasser area taken from CitationCONOCO (1987).
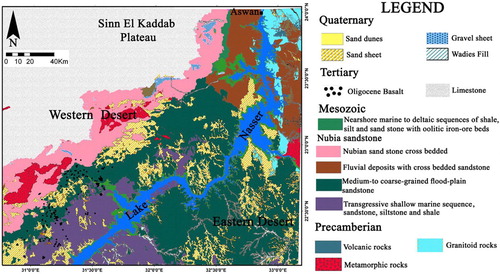
Fig. 3 Distribution of Earthquake epicentral in/and around the Tushka New City site dropped on a topographic map (DEM from a satellite dataset). These data were collected from Aswan, Abu–Simbil, Marsa Alam seismic stations, Aswan seismic network and Egyptian National Seismic Network during 1982 to 2014.
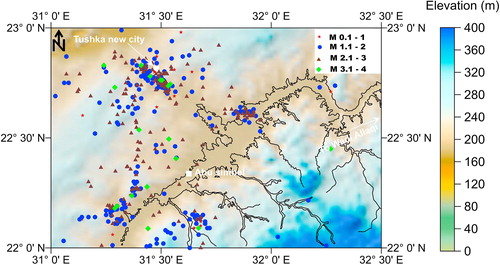
Fig. 4 Cross section shows distributions of earthquake events in south-north direction crossing Tushka New city area.

Fig. 5 Cross section shows distributions of earthquake events in west-east direction crossing Tushka New city area.
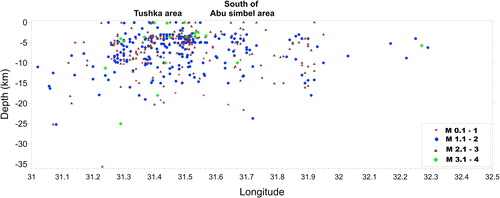
Fig. 6 (a) Bouger anomaly map of the study area compiled by the Egyptian General Petroleum Corporation [E.G.P.C.] (1980). The white lines refer to the locations of profiles using for 2D modeling, and its derivative maps; (b) the first vertical gradient, (c) a horizontal gradient, and (d) a tilt gradient.

Fig. 7 Two-dimensional gravity models along four N–S and E-W profiles. Numbers in the cross-section denote model densities in kg/m3 and the locations of these profiles are shown in a.

Fig. 8 Interpreted geoelectrical cross section along profile (A-A′), the numbers inside the cross section refer to apparent resistivites in ohm m. The location of the profile is shown in .
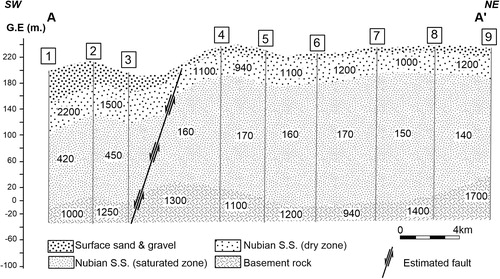
Fig. 9 Interpreted geoelectrical cross section along profile (B-B′), the numbers inside the cross section refer to apparent resistivites in ohm m. The location of the profile is shown in .
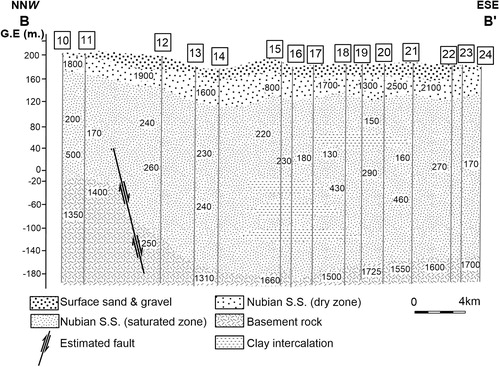
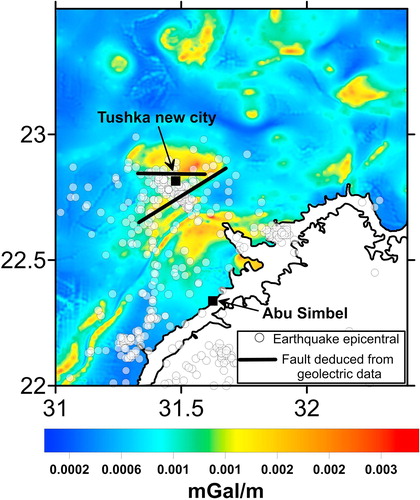
Fig. 10 An integrated map of analytical signal of Bouguer anomaly map, distribution of Earthquake epicentral and faults deduced from geoelectrical profiles.