Figures & data
Fig. 6 Percentage passing 0.075 mm sieve (PCS) versus apparent resistivity (ρa).
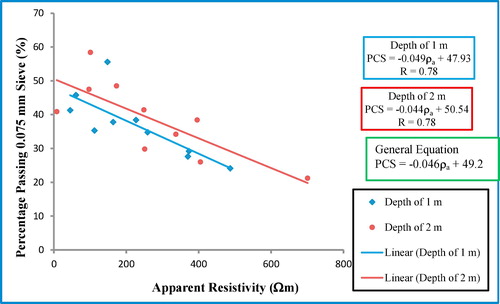
Fig. 7 Specific gravity (SG) versus apparent resistivity (ρa).
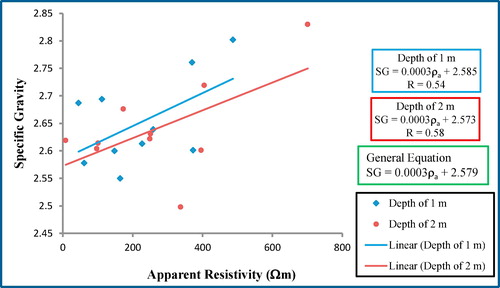
Fig. 8 Liquid limit (LL) versus apparent resistivity (ρa).
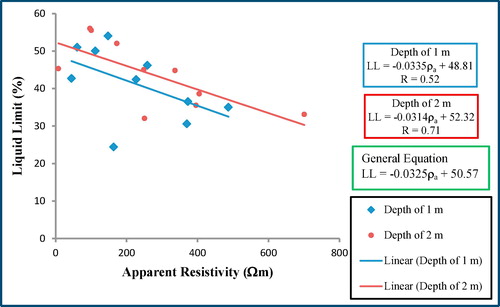
Fig. 9 Plastic limit (PL) versus apparent resistivity (ρa).
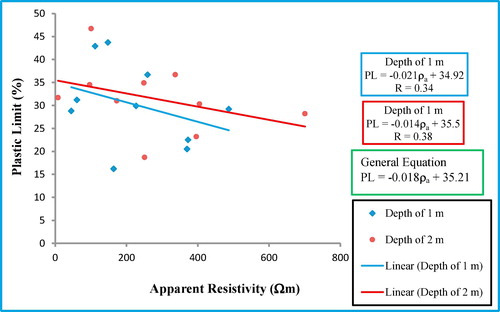
Fig. 10 Plasticity index (PI) versus apparent resistivity (ρa).
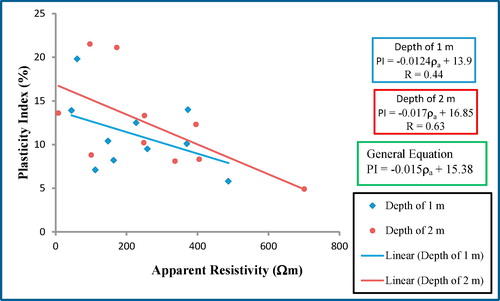
Fig. 11 Linear shrinkage (LS) versus apparent resistivity (ρa).
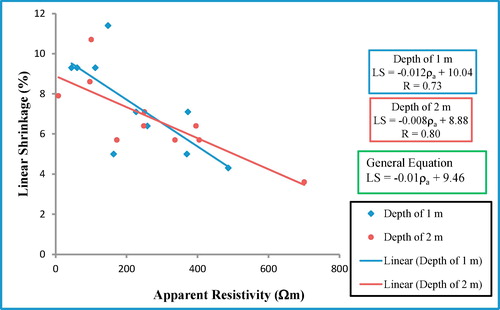
Fig. 12 Optimum moisture content (OMC) versus apparent resistivity (ρa).
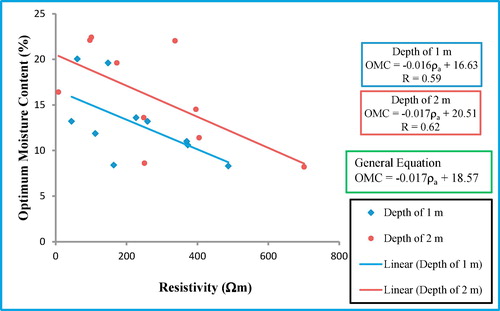
Fig. 13 Maximum dry density (MDD) versus apparent resistivity (ρa).
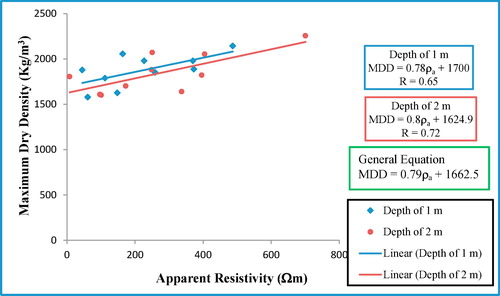
Fig. 14 California bearing ratio (CBR) versus apparent resistivity (ρa).
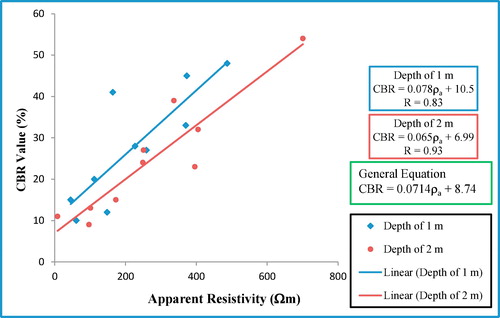
Fig. 1 Map of the Federal University of Technology, Akure (FUTA) showing the study area.
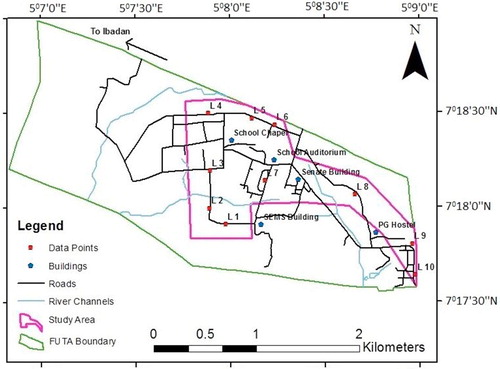
Fig. 2 Topographic map of the study area.
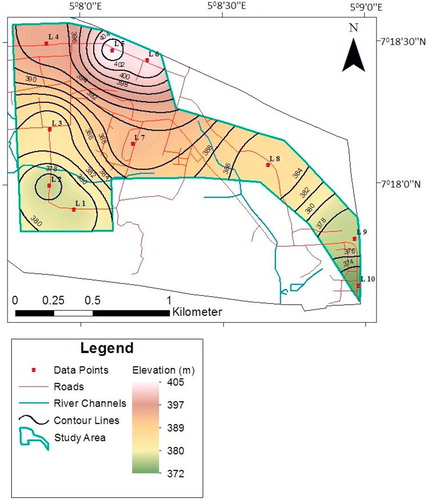
Fig. 3 Geological map of the study area showing the sample locations (modified after CitationKareem, 1997).
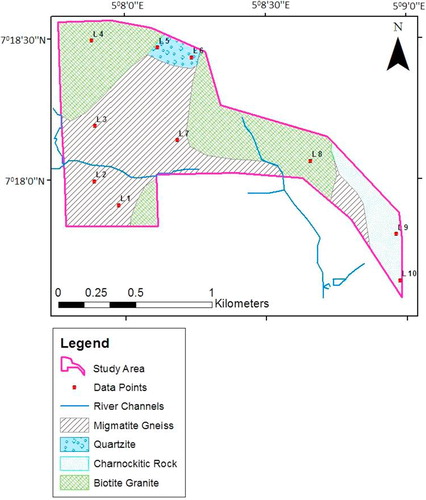
Fig. 4 Schlumberger configuration flow pattern used for the electrical resistivity measurement.
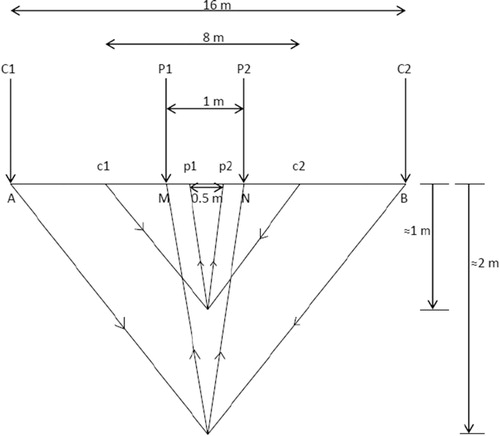
Fig. 5 Natural moisture content (NMC) versus apparent resistivity (ρa).
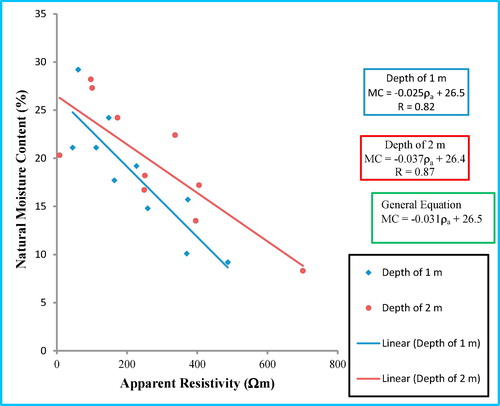
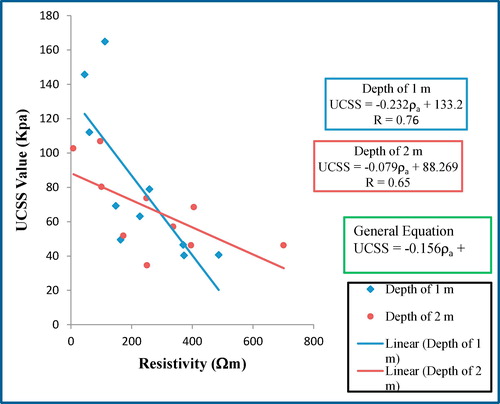
Fig. 15 Unconfined compression shear strength (UCSS) versus apparent resistivity.