
Figures & data
Fig 1. The Nile Basin.
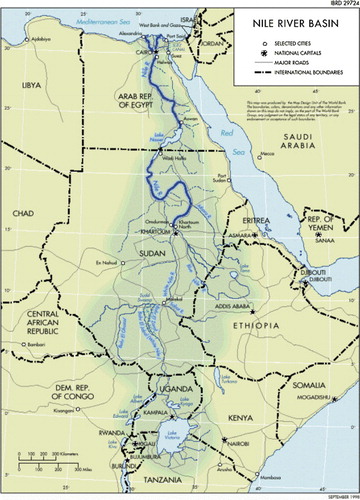
Table 1. Irrigation and hydropower potential of Nile Basin countries.
Fig 2. Schematic of the Nile Economic Optimization Model (for simplicity, only reservoir and irrigation nodes are numbered).
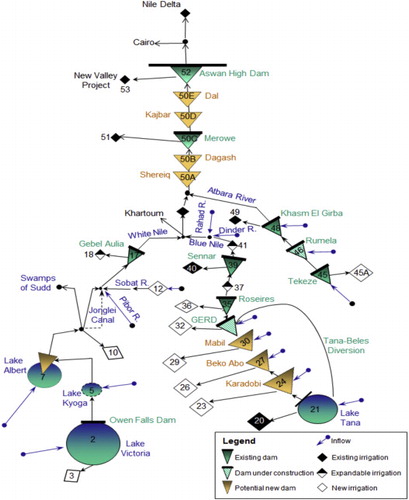
Table 2. The three dimensions of uncertainty considered in this analysis.
Table 3. Differences in assumptions governing the variation across political scenarios.
Table 4. Total economic benefits (in billions of US$/y) under different scenarios of political uncertainty.
Table 5. Total economic benefits (in billions of US$/y) under different scenarios of hydrological uncertainty and political uncertainty.
Table 6. Total economic benefits (in billions of US$/y) under different scenarios of economic uncertainty.