Figures & data
Table 1 Descriptive characteristics of sample 50 years and older by gender, 2005 and 2012, SABSSM survey.
Table 2 Factors associated with sexual activity among older adults (50 years and older), 2012 SABSSM survey.
Table 3 Gender differences in sexually active life expectancy by health status at ages 50, 60, 70 and 80, based on the 2005 and 2012 SABSSM surveys.
Figure 1. Sexually active life expectancy in South African men and women in Good or Poor Health, based on 2005 SABSSM surveys.
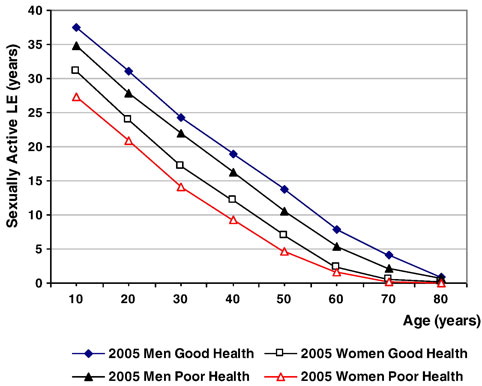
Figure 2. Sexually active life expectancy in South African men and women in Good or Poor Health, based on 2012 SABSSM surveys.

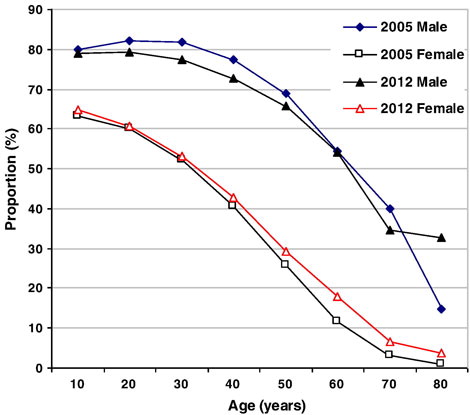
Figure 3. Proportion of remaining sexually active life for men and women, 2005 and 2012.