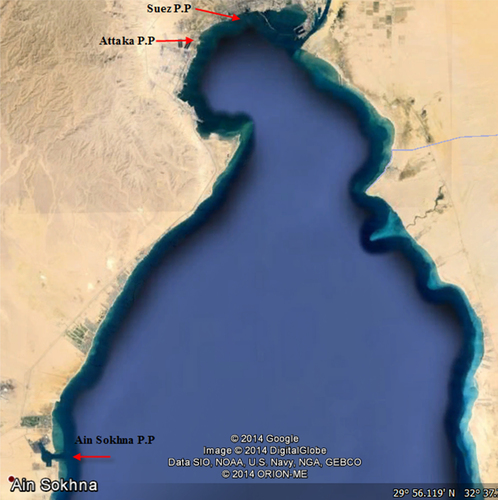
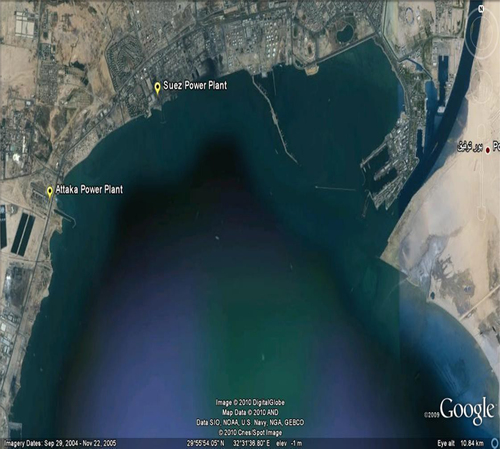
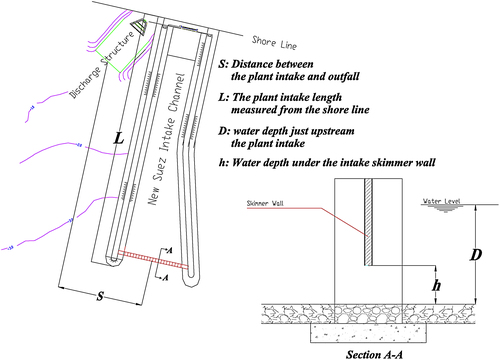
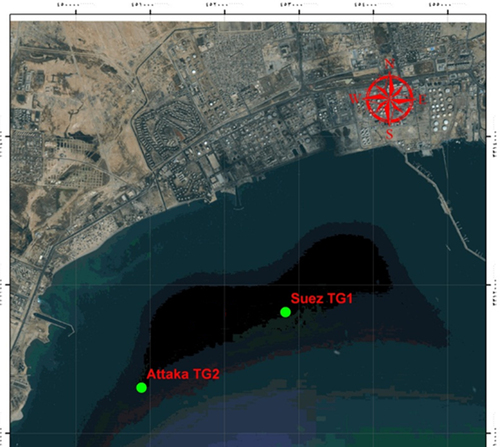
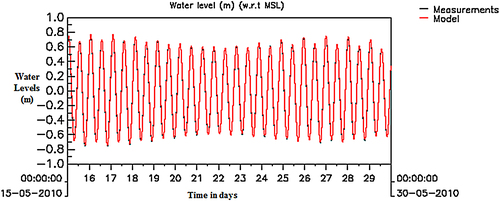
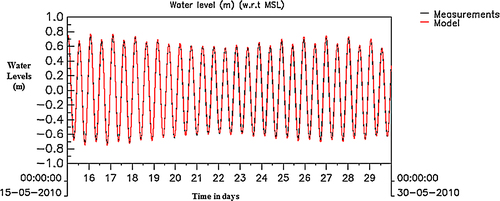
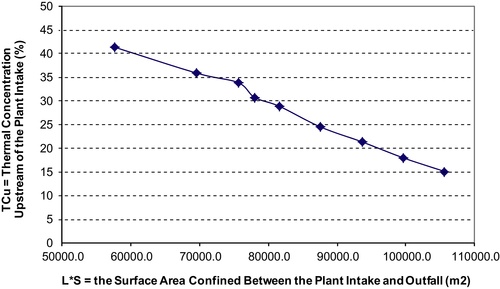
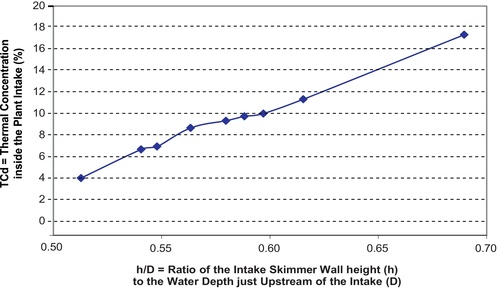
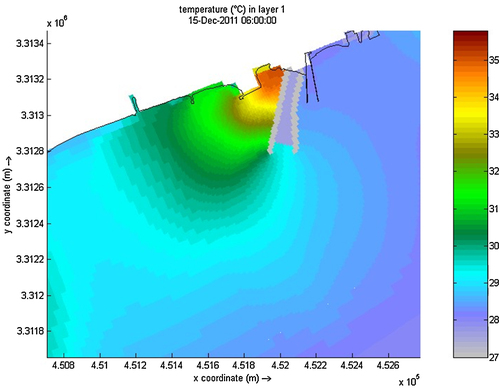
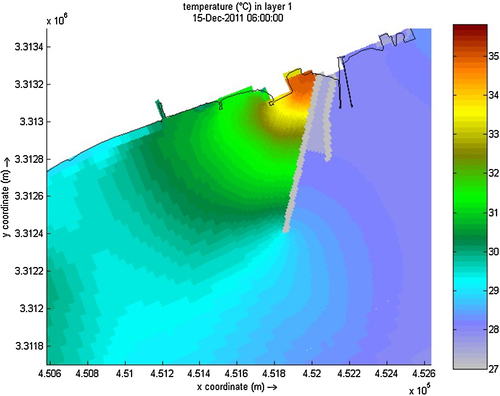
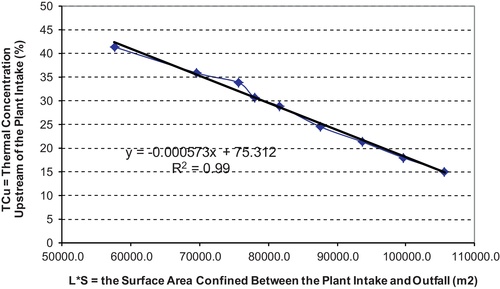
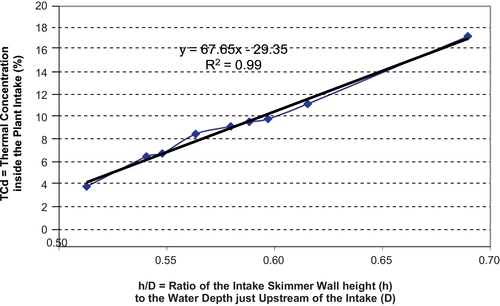
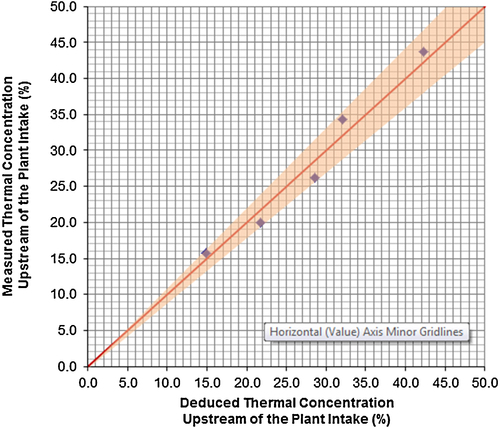
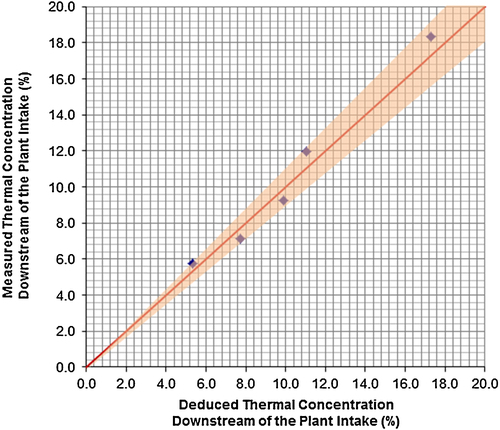
Figures & dataDisplay full sizeFig. 1 Overall view of the power plants at Suez Gulf.Display full sizeFig. 2 Detailed view of the Suez Gulf Study Area.Display full sizeFig. 3 Detailed view for the tested parameters in this study.Display full sizeFig. 4 The location of water level measurements in the model area, TG1 (Suez Station) and TG2 (Attica Station).Display full sizeFig. 5 The modeled and observed water levels at station TG1 (Suez Station).Display full sizeFig. 6 The modeled and observed water levels at station TG2 (Attica Station).Display full sizeTable 1 Model scenarios simulations with varied L × S values.Download CSVDisplay TableTable 2 Model scenarios simulations with varied h/D ratios.Download CSVDisplay TableFig. 7 Water thermal concentration upstream of the plant intake for the eight scenarios (prototype values).Display full sizeFig. 8 Water thermal concentration inside the plant intake just downstream the skimmer wall for the eight scenarios (prototype values).Display full sizeFig. 9 Temperature distribution near the water surface for scenario 1 (Suez Power Plant)Display full sizeFig. 10 Temperature distribution near the water surface for scenario 8 (Suez Power Plant)Display full sizeFig. 11 Relation between TCu and (L × S).Display full sizeFig. 12 Relation between TCd and (h/D).Display full sizeFig. 13 Excess temperature above the ambient water at the vicinity of New Suez Power Plant.Display full sizeFig. 14 Temperature distribution near the New Suez Power Plant.Display full sizeFig. 15 Relation between measured and deduced thermal concentration upstream of the New Suez Power Plant intake.Display full sizeFig. 16 Relation between measured and deduced thermal concentration downstream of the New Suez Power Plant intake.Display full sizeTable 3 Measured thermal concentration upstream of the NSPP intake.Download CSVDisplay TableTable 4 Measured thermal concentration downstream of the NSPP intake.Download CSVDisplay Table