646
Views
12
CrossRef citations to date
0
Altmetric
Research Articles

Assessing the drain estuaries’ water quality in response to pollution abatementFootnote

Pages 1-18 | Received 20 Dec 2014, Accepted 19 Feb 2015, Published online: 03 May 2019

Figures & data

Fig. 1 Water balance in Egypt 2013.
Fig. 2 The Nile's hydrological cycle.
Fig. 3 Water quality monitoring locations over Nile Delta and their covered reaches.

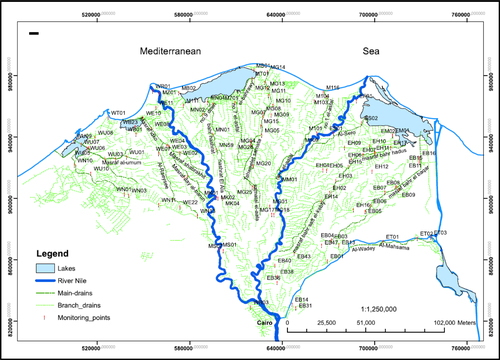
Table 1 Drains discharged to coast Delta lagoons and Mediterranean Sea.

Table 2 Test of normality.

Fig. 4 Temporal trends in indicators of water quality index for the drainage water flowing to Lake Manzala; (a) Bahr ElBaqar Drain, (b) Bahr Hadus Drain, (c) Matareya Drain, and (d) Ramsis Drain.

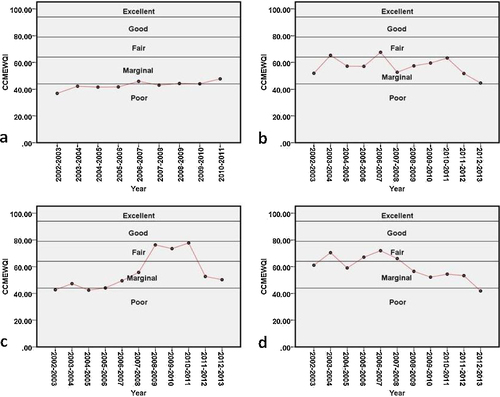
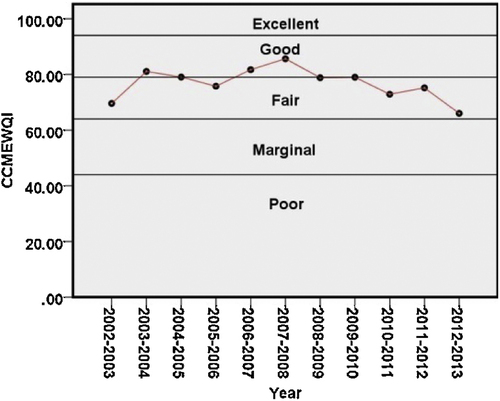
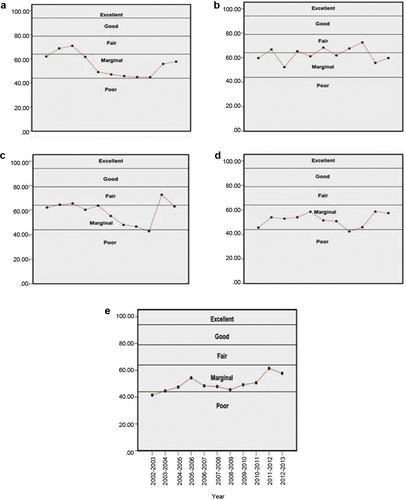
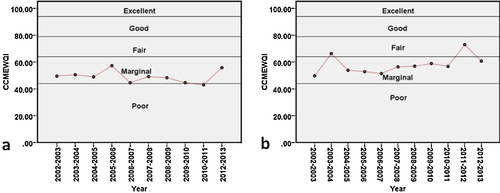
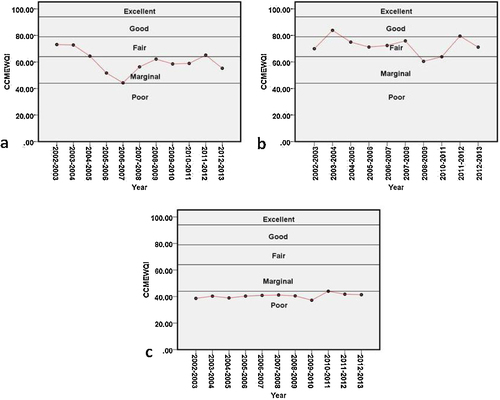
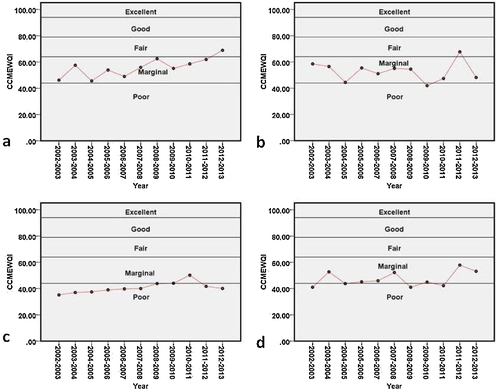
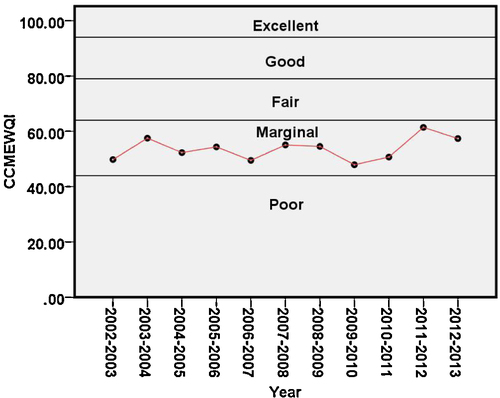
Table 3 Temporal trends of WQI (Y) over time period from 2002 to 2013 (X) of drains discharged to coast Delta lagoons and Mediterranean Sea.

Fig. 5 Temporal trends in indicators of water quality index for the Mahsama drainage water flowing to Lake Timsah.
Fig. 6 Temporal trends in indicators of water quality index for the drainage water flowing to Lake Burullus; Nashart Drain, Tira Drain, No. 7 Drain, Lower No. 8 Darin, and No. 11 Drain (from top to bottom, respectively).
Fig. 7 Temporal trends in indicators of water quality index for the drainage water flowing to Lake Edko; (a) Edko Drain, and (b) Barsiq Drain.
Fig. 8 Temporal trends in indicators of water quality index for the drainage water flowing to Lake Mariut; (a) El Umum Drain, (b) West Nubaria Drain, and (c) El Qalaa Drain.
Fig. 9 Temporal trends in indicators of water quality index for the drainage water flowing to Mediterranean Sea; (a) Drain No. 1, (b) Gharbia Drain, (c) Tabia Drain, and (d) Max pump station.
Fig. 10 Temporal trends in indicators of median water quality index for the drainage water flowing to Northern Lakes or Mediterranean Sea.

Table 4 Temporal trends of WQI (Y) over normalized sum of total coliform excursionsTable Footnotea (X) from 2002 to 2013 of drains discharged to coast Delta lagoons and Mediterranean Sea.

Table 5 Number of sewage water treatment plants in fiscal year 2010/2011.