363
Views
6
CrossRef citations to date
0
Altmetric
Review Article

Satellite data and real time stations to improve water quality of Lake ManzalahFootnote

Pages 68-76 | Received 28 Oct 2014, Accepted 24 Mar 2015, Published online: 03 May 2019

Figures & data

Fig. 1 Location of the study area.
Fig. 2 RTWQ station locations at Lake Manzalah.
Fig. 3 Variability of turbidity and chlorophyll at RTWQ stations.

Table 1 Descriptive statistics of in situ water quality parameters.

Table 2 Correlation between water quality parameters and WeW/FUB output.

Table 3 Correlation between water quality parameters and processor output.

Fig. 4 Log-transformed TOA band ratio vs. log-transformed TUR and CHL.

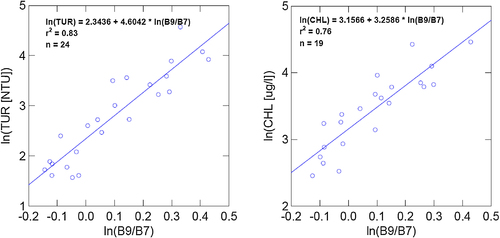
Table 4 Correlation between water quality parameters and TOA band ratios.

Fig. 5 Satellite-derived water quality products – July 29, 2009.