283
Views
1
CrossRef citations to date
0
Altmetric
Research Articles

Enhancing flow pattern upstream of New Hafeer Pump StationFootnote

Pages 16-31 | Received 21 Dec 2017, Accepted 19 Feb 2018, Published online: 03 May 2019

Figures & data

Table 1 Reynolds number values in the model.

Fig. 1 HSD physical model general layout.
Fig. 2 Comparison between simulated and observed velocities (C. S. 1).
Fig. 3 Comparison between simulated and observed velocities (C. S. 2).
Fig. 4 Comparison between simulated and observed velocities (C. S. 3).
Fig. 5 Comparison between simulated and observed water levels (HSD right bank).
Fig. 6 Comparison between simulated and observed water levels (HSD left bank).

Table 2 Fcritical and corresponding Fvalue for model calibration.

Table 3 Coefficient of determination for observed and simulated velocities.

Fig. 7 Model arrangements (existing situation).
Fig. 8 Model arrangements (first modification).
Fig. 9 Model arrangements (second modification).
Fig. 10 Model arrangements (third modification).
Fig. 11 Model arrangements (fourth modification).
Fig. 12 Velocity distribution at C.S.1.
Fig. 13 Velocity distribution at C.S.2.
Fig. 14 Velocity distribution at C.S.3.
Fig. 15 Discharges passed from NHPS units (all modification).

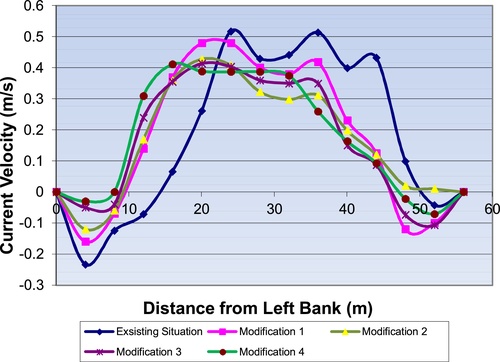
Table 4 Summary of the four complementary modifications.

Supplemental material

Supplementary Photo 1

Download MS Word (89 KB)

Supplementary Photo 2

Download MS Word (137 KB)

Supplementary Photo 3

Download MS Word (142.3 KB)

Supplementary Photo 4

Download MS Word (140.4 KB)

Supplementary Photo 5

Download MS Word (534.6 KB)

Supplementary Photo 6

Download MS Word (526.1 KB)