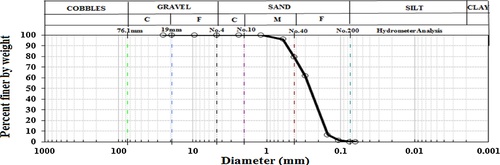
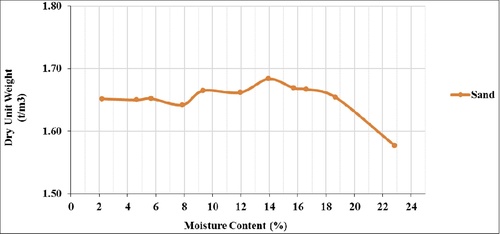
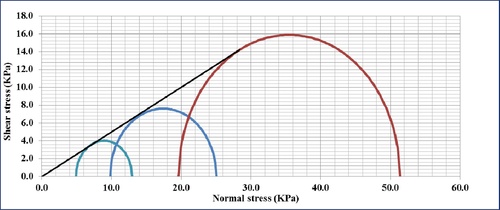
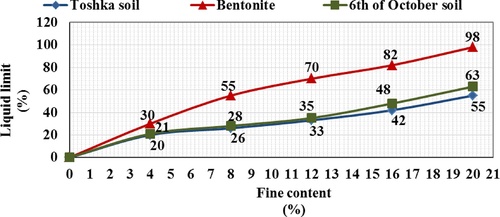
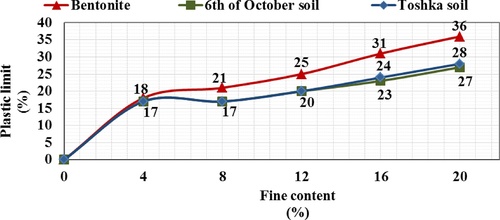
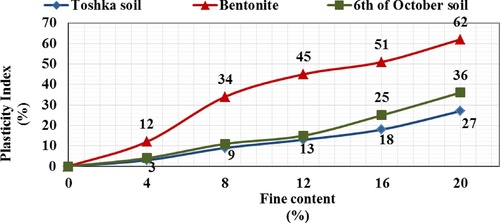
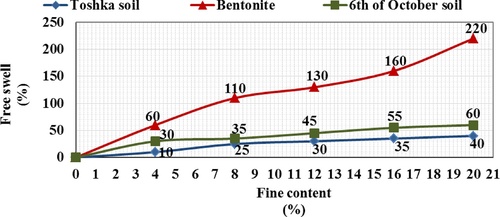
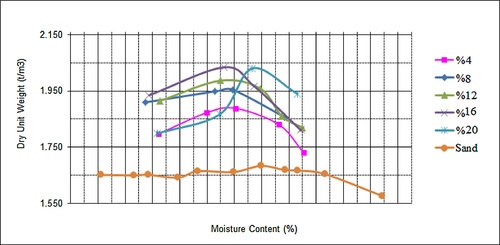
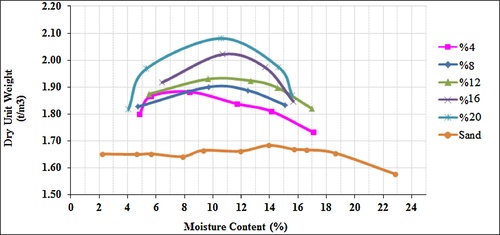
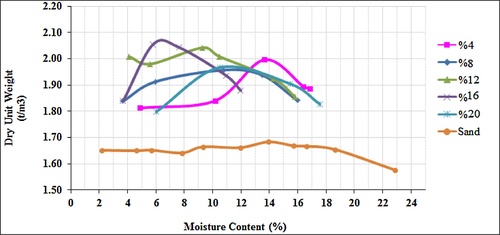
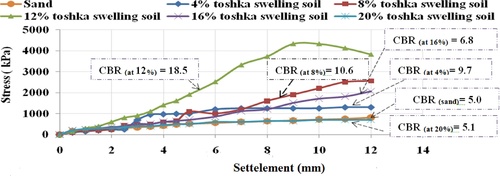
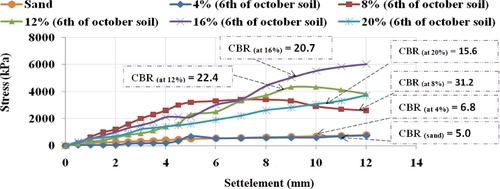
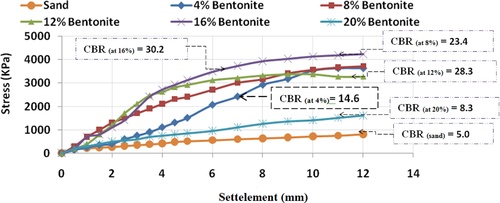
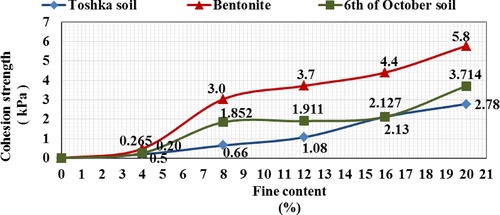
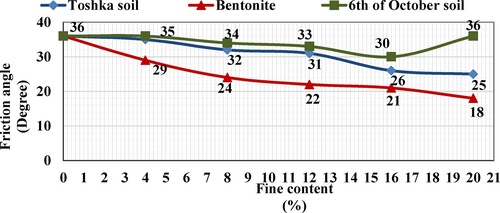
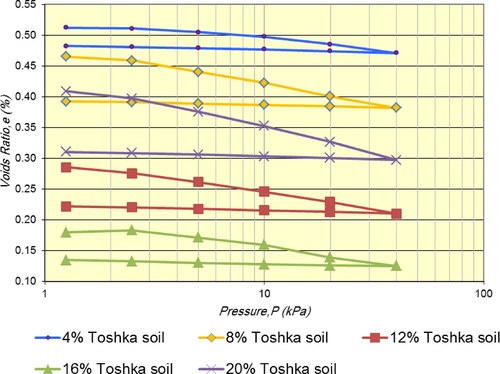
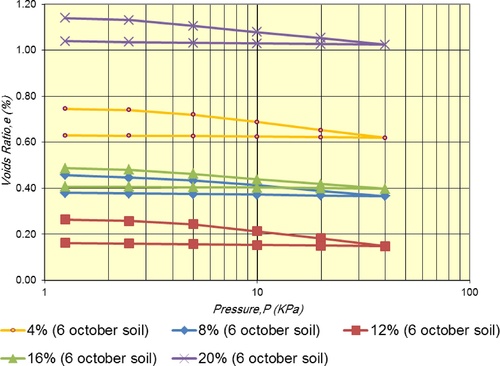
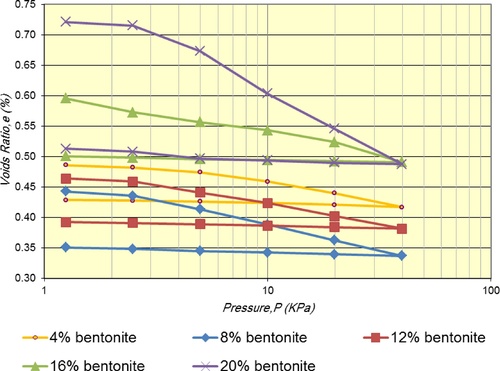
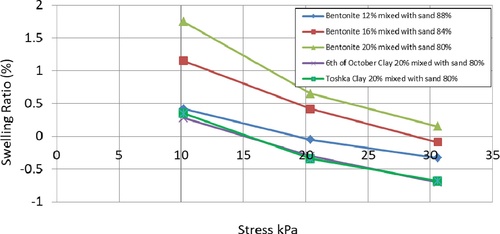
Figures & dataTable 1 Physical properties of the used admixtures.Download CSVDisplay TableTable 2 Minerals of the natural tested sand and the used admixtures.Download CSVDisplay TableFig. 1 Grain size distribution curve of the natural siliceous sand (S1).Display full sizeFig. 2 Modified proctor curve for the natural tested sand.Display full sizeFig. 3 Mohr circles results for natural soil.Display full sizeFig. 4 Effect of fines type and fines content on the liquid limit of the mixtures.Display full sizeFig. 5 Effect of fines type and fines content on the plastic limit of the mixtures.Display full sizeFig. 6 Effect of fines type and fines content on the plasticity index of the mixtures.Display full sizeFig. 7 Effect of fines type and fines content on the free swell of the mixtures.Display full sizeFig. 8 Modified proctor curves for the used Toshka mixtures.Display full sizeFig. 9 Modified proctor curves for the used 6th of October mixtures.Display full sizeFig. 10 Modified proctor curves for the used bentonite mixtures.Display full sizeTable 3 Modified proctor compaction relationship for natural and improved soils.Download CSVDisplay TableFig. 11 California bearing ratio curves for the Toshka mixtures after four days soaking in water.Display full sizeFig. 12 California bearing ratio curves for the 6th of October mixtures after four days soaking in water.Display full sizeFig. 13 California bearing ratio curves for the bentonite mixtures after four days soaking in water.Display full sizeFig. 14 Cohesion strength of the tested mixtures.Display full sizeFig. 15 Friction angle of the tested mixtures.Display full sizeFig. 16 Consolidation test (e-log p Curve) for the Toshka mixture.Display full sizeFig. 17 Consolidation test (e-log p Curve) for the 6th of October mixture.Display full sizeFig. 18 Consolidation test (e-log p Curve) for the bentonite mixture.Display full sizeFig. 19 Swelling ratio of sand mixtures.Display full sizeTable 4 Permeability values of the improved soils.Download CSVDisplay Table