Figures & data
Table 1 Properties of S. flexneri serotype 3a, 3b, 4b and 1b strains analyzed in this study
Table 2 Primers used in this study
Figure 1 Comparison of protein Oac1b and Oac. (A) Plot of variation between Oac1b and Oac. Nucleotide differences were plotted across the horizontal axis with synonymous and non-synonymous mutations plotted as black and red vertical lines. Ticks and numbers across the horizontal axis are base positions. Transmembrance (TM) segments as predicted by Verma et al. are shown in yellow boxes below the gene. The critical residues for Oac function are indicated by green stars. The ratio of non-synonymous and synonymous substitution rate (Ka/Ks) across the gene using a sliding window of 90 bases (30 codons) and overlap of 3 bases (1 codon) is shown above the gene. (B) Pair-wise list the amino acid sequences of protein Oac1b and Oac. Lines represent amino acid residues that are identical, whereas dots represent amino acids that are similar. TM segments are indicated in red color. The three major regions conserved among the inner membrane trans-acylase family proteins are boxed. The three critical residues for Oac function are marked by asterisk.
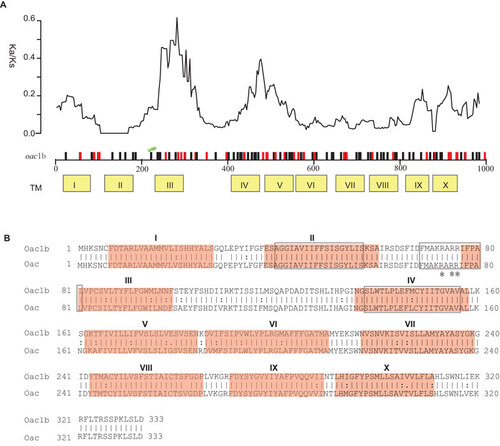
Figure 2 Genomic structure of the oac1b region. (A) Comparison of chromosomal regions flanking O-acetyltransferase gene oac1b in serotype 1b strains, and oac in serotype 3a, 3b and 4b strains and serotype-converting phage Sf6. Regions sharing >85% sequence identity are indicated by shaded boxes. Genes coding the same function are shown in the same color. Key primers used in this study are marked by arrows. (B) Genomic structure of regions flanking O-acetyltransferase gene oac1b in serotype 1b strain 1997020 and comparison with relevant regions of sequenced S. flexneri strain 301, 2457t and 2002017. The details of ORFs in strain 1997020 are listed in Supplementary Table S1. Genes share high homologies are shown in the same color. (C) Comparison of the genomic structure of oac1b-carrying prophage in serotype 1b strain 1997020 with prophage genomes in Salmonella enterica serovar Paratyphi B strain SPB7 and E. coli O127:H6 strain E2348/69. Genes sharing >40% identity at amino acid level between the strains are marked by color, red, >80% identity; yellow, 60%–80%; blue, 40%–60%.
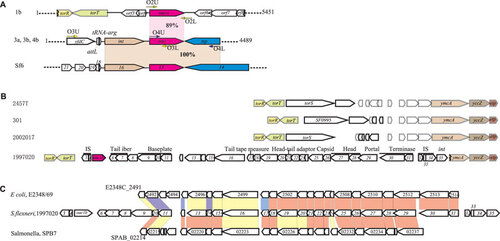
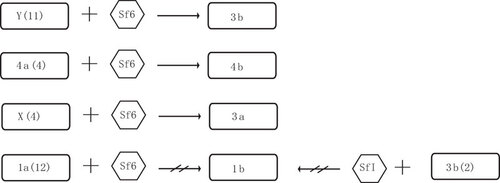
Figure 3 Schematic diagram of sensitivity of S. flexneri serotypes (1a, X, Y and 4a) to serotype-converting phage Sf6 and serotype 3b to serotype-converting phage SfI. Numbers of strains tested were showed in parentheses.