Figures & data
Figure 2 Presence of 20 kDa (NS3) band. (A) Immunobloting for endogenous NS1 in A549 or M1 cells infected with the wt, M124I, D125G or the double-mutant (M124I+D125G) NS1 gene viruses (MOI 3) or mock infected with PBS, 8 hpi. (B) Immunoblots for endogenous NS1 in M1 cells infected with a mouse adapted A/HK/1/68-11-MA21-1 virus possessing the NS1 D125G(GAT→GGT) mutation (MOI 0.5), human wt NS1 virus (MOI 3) or mock infected with PBS, 8 hpi. (C) Effect of NS mutations on the rate of viral protein synthesis in infected A459 cells. A549 cells were infected (MOI 5) and pulsed for 1 h with S35 8 hpi. Cell lysate was collected and used for SDS–PAGE and autoradiography.
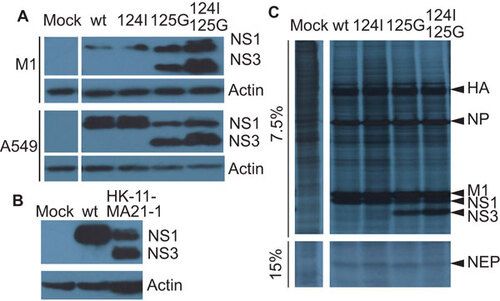
Figure 3 Characterization of NS3 by mass spectrometry. (A) Workflow for the production and purification of NS1 and 20 kDa (NS3) proteins for LC–MS–MS sequencing. (B) Identification, relative abundance, and sequence of extracted ion chromatogram peaks of NS1 wt or mutant tryptic peptides found in the NS1 and NS3 protein. (C) Relative abundance of extracted ion chromatogram peaks of a joining tryptic peptide with NS1 amino acids 125 bonded to 168. The MS/MS spectrum for fragment ions of NS3 joining peptide is included in Supplementary Figure S2. Approximate position of tryptic peptide relative to NS1 and NS3 is shown on schematic maps of the NS1 and NS3 proteins. Sequence coverage is included in Supplementary Figure S1.
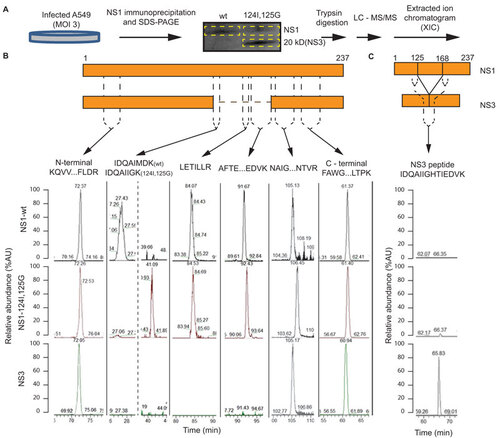
Figure 4 The NS1 D125G(GAT→GGT) mutation results in the formation of a novel splice product encoding NS3. (A) NS gene vRNA and mRNA from wt, M124I, D125G or the double-mutant (M124I+D125G) NS1 gene containing viruses were extracted from infected M1 cells (MOI 3) and amplified as cDNA by RT-PCR and were separated by agarose gel electrophoresis. Asterisk denotes bands corresponding to a NS1–NS3 hybrid artefact. (B) Schematic representations of NS transcripts, (NS1, NS3 and NEP), identified by sequencing of the PCR cDNA products. (C) Location of predicted alternative splice sites of wt, M124I, D125G and double-mutant (M124I+D125G) NS genes. (D) Nucleotide sequences of predicted splice site with likelihood scores (for sites in panel C) and resulting splice products (NEP or NS3) is shown for the NS1 wt, D125G and double-mutant (M124I+D125G). Human donor and acceptor splice site consensus sequences are shown above the splice sites of the NS genes. Position of the 124I and 125G mutations are highlighted in yellow and green respectively. (E–G), Levels of mRNA and vRNA. Quantitative RT-PCR was performed on total RNA from M1 cells infected with NS1 wt or mutant viruses (MOI 2), (n=3). (E) mRNA levels of NP, M1, NS1, NEP genes are shown relative to NS1-wt. (F) mRNA level of the NS3 transcripts. ND, Not detected. (E) vRNA levels of the NP, M, NS gene. (E, G) Results were normalized to β-actin levels, and presented as values relative to wt RNA levels. (E) Results were normalized as values relative to β-actin levels. (*P<0.05; **P<0.01; ***P<0.001; P value was determined by two-tailed student t with equal variance, (E,G) comparing the mutants to wt, (F) comparing the 125G to the double-mutant. Error bars indicate s.e.m.)
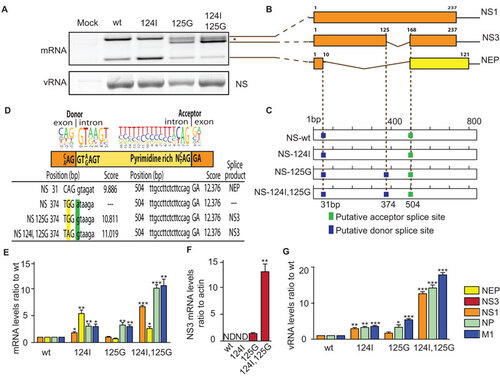
Figure 5 Synthetic production of NS3. (A) In vitro expression of wt and 125G(GGT) NS1 and NS3 from coupled T7 transcription and reticulocyte translation of expression plasmids or empty vector in the presence of 35S labeled methionine and cysteine. Cell lysate was collected and used for SDS–PAGE and autoradiography. (B) Immunoblots for NS1 in transfected 293T cells with NS1 (wt, 125G(GGT) or 125G(GGC) mutants) or NS3 expression plasmids. Cell lysate was collected 24 h post-transfection. Control immunoblot is shown for endogenous NS1 and NS3 proteins in M1 cells infected with mutant NS1.
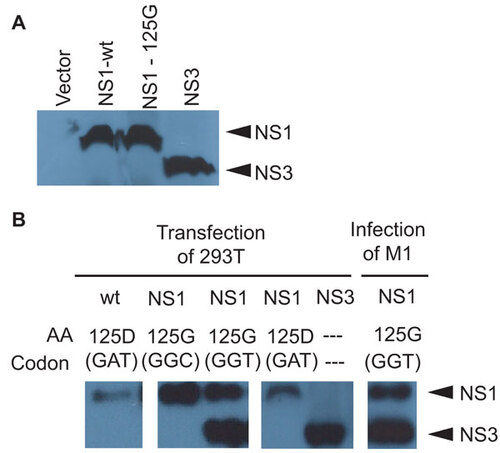
Figure 6 Effect of novel NS splicing on viral replication. (A) Schematic representations of the NS gene and its corresponding splice sites with predicted proteins from the NS1-wt, and NS3 splicing competent 125G(GGT), and splicing incompetent 125G(GGC) and 125G(GGG) mutants. (B) Immunobloting for endogenous NS1 and NS3 protein production in M1 cells infected with HK NS1 125G(GGT), 125G(GGC) and 125G(GGG) viruses or mock infected with PBS, 24 hpi showing an absence of NS3 protein for viruses without the NS3 donor splice site. (C) Virus growth in MDCK (MOI 0.001; n=3), M1cells (MOI 0.001; n=3) and in CD-1 mice (n=3) infected with influenza A viruses containing the either NS1-wt, NS3 splicing competent NS1 125G(GGT), or splicing incompetent 125G(GGC) and 125G(GGG) mutants. (**P<0.01; ***P<0.001; P value was determined by two-tailed student t with equal variance, comparing the mutants or wt to the 125G(GGT) at 48 hpi or 1 day post-infection. Error bars indicate s.e.m.)
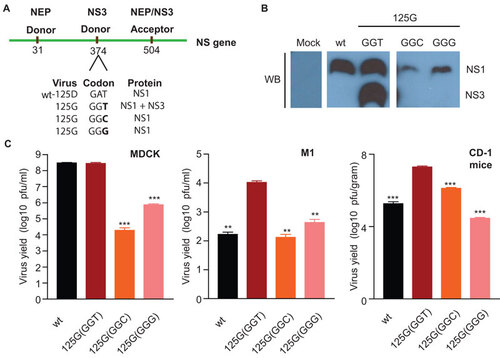
Table 1 List of virus containing the NS1 125G(GGT) codon. Viruses are grouped according to phylogenetic origin
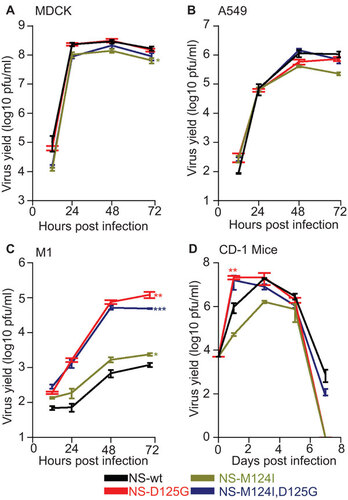
Figure 1 Host specific effects on viral replication. Virus growth in (A) MDCK , (B) A549, (C) M1cells (MOI 0.001, n=3) and (D) CD-1 mice (n=12) infected with influenza A viruses containing either the wt, M124I, D125G or the double-mutant (M124I+D125G) NS1 genes. (*P<0.05;**P<0.01; ***P<0.001; P value was determined by two-tailed student t with equal variance, comparing the mutants to wt 72 hpi or 1 day post-infection. Error bars indicate s.e.m.)