Figures & data
Figure 1 Rhesus macaque sampling site locations including relative geographic proximity and historical and extant forest patches. Rhesus macaques, Macaca mulatta, were sampled from six geographically distinct sites in Bangladesh (n=126). Concentric circles in 10 km intervals from the epicenter of the sites are shown. Existing forest areas are noted in dark green and historical forest cover is shown in lighter green. Natural macaque migration would have been possible between sites that were connected by forested areas. Nomadic Bade people travel throughout the subcontinent with their performing macaques. We sampled 38 of these performing monkeys from multiple locations within the shaded light blue area.

Table 1 Each area, estimated population size and number of monkeys sampled by age class and sex
Figure 2 Relationship between monkey and viral population structures. Each animal is represented by a single column spanning the figure’s sections. Columns are sorted by viral diversity, animal age, and sampling population. (A) Normalized Hamming distance for each pair of clones from each animal, representing intra-host viral diversity. The dotted line represents expected distance (due to PCR error) between distinct PCR products of a single DNA molecule. (B) The identifier of the animal to which each column corresponds. Respectively, (C), (D) and (E) represent number of viral clones, animal age class and sampling population for each monkey. (F) Microsatellite clusters as inferred by STRUCTURE; admixture between genotype clusters is represented by bar height. Microsatellite colors are assigned according to an observed correlation with sampling location. (G) Viral strains cloned from each animal, classified as described in the text. All sampled monkeys are represented except for one FV negative infant monkey (MBG211).

Figure 3 Foamy virus sequence diversity overview. Phylogenetic tree built from all sequenced gag nucleotide clones using FastTree using the Jukes–Cantor sequence evolution model. Due to recombination, this tree should not be interpreted as an evolutionary history, but rather as an indication of the clustering seen in the sequence data. The edges of the tree are labeled with SH-like local supports.

Table 2 Assay of anti-Gag antibodies using ELISA
Table 3 Geographic and age distribution of SFV seropositive rhesus macaques
Figure 4 Splits network giving an overview of sequence diversity, and built by SplitsTree with strain labels. SplitsTree produces a ‘splits network’ capable of displaying non-treelike sequence difference information in a graphical form. In the figure, each set of parallel edges represents a ‘split’, which is a collection of sequence differences that separates one group of sequences from another. In this case, non-tree-like evolution is expected to be from recombination; putative recombinant sequences are found at the end of the parallelograms formed by edges. Strain labels have multiple identifiers if they were found to be recombinant by cBrother; e.g., a/b indicates a recombinant between core sequences a and b. An underscore (_) indicates the presence of a >200 bp region in which no one core strain was clearly found as the source.
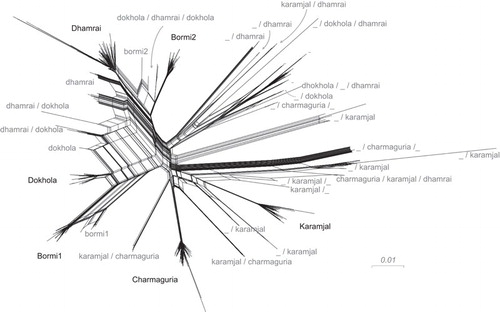
Figure 5 Amino-acid alignment of ‘Core’ strain representatives. Translated Gag sequence alignment between strain representatives compressed to variable sites. The numbers on the top of the figure show the position of these non-constant columns relative to the beginning of our gag sequencing region: the top digit is the 100’s place, the middle the 10’s place, and the bottom is the 1’s place.
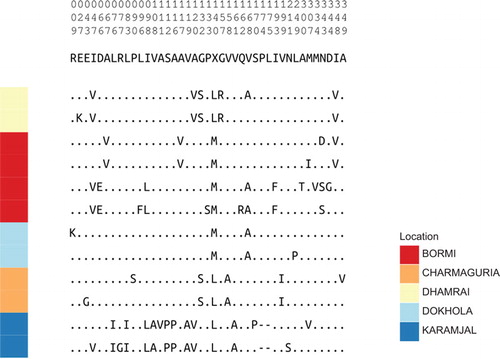
Figure 6 Recombination between Bormi strains and non-recombinant parental strains. Phylogenetic trees constructed by running PhyML on representative sequences which have been partitioned into separate alignments along recombination breakpoints inferred by cBrother. (A) and (B) show the relationship between Bormi1 and the core strains; (C) and (D) the relationship between Bormi2 and the core strains. (A) is built from sequence data between nucleotides 1 and 304, (B) from 305 on, (C) from 1 to 496 and (D) from 497 on (nucleotide (nt) number refers to position in the 1125 nt fragment of gag we sequenced, not to the nt position of the full length gag gene). Internal branches are labeled with their bootstrap values to indicate confidence.
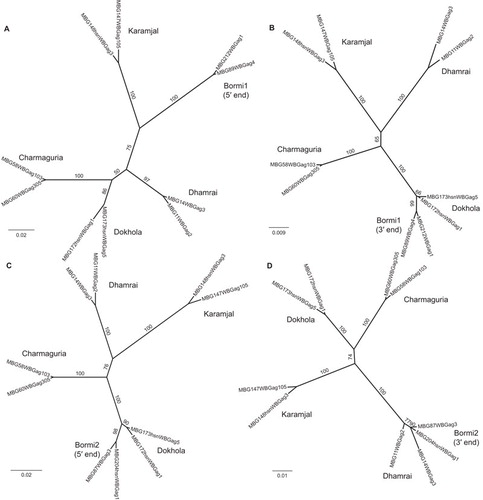
Table 4 Percentage of amino-acid sequence similarityFootnotea in the region of gag analyzed between strains and SFV-1
Table 5 Infectivity of SFV-1 with a 6 nucleotide deletion in gag