Figures & data
Figure 1 Geographical distribution of cities infected by the H7N9 virus in China from March to May 2013. The first day of illness onset for the first patient in each city was taken as the day when the city was infected. Infected cities were divided into two waves, separated by April 5, 2013. Cities in the first and second waves are labeled by a yellow and red circle, respectively. The cities where the virus was detected in birds are labeled by a blue star.

Figure 2 Provincial topological map of the spread of the H7N9 virus based on the live bird trade. A force-directed graph was drawn based on CC and IC. The infected provinces in the first (yellow node) and second (red node) waves and in provinces without infection reports (grey node) were connected according to live bird trade information weighted by the number of queries. The accumulated value to support trading information for each city is marked below its name. A concentric circle indicates the putative risk of the H7N9 virus. Provinces with birds that tested positive are labeled by a blue star.

Figure 3 City topological map of the spread of the H7N9 virus based on the live bird trade. A force-directed graph was drawn based on CC and IC. Infected cities in the first (yellow node) and second (red node) waves and cities with no infection reports (grey node) were connected according to live bird trade information using information number as the weight. Cities with birds that tested positive are labeled by a blue star.
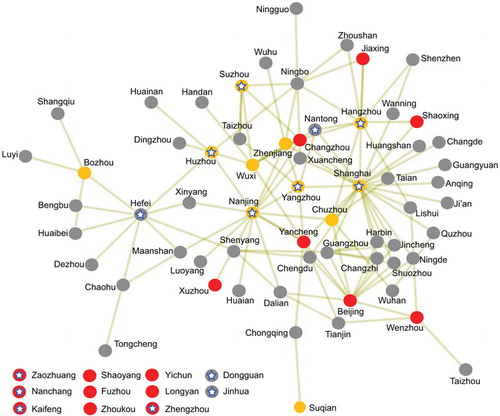
Figure 4 Proposed transmission networks of the H7N9 virus based on live bird trade information. Cities in different infection waves are represented by red, yellow, and grey nodes. Cities where the virus was detected in birds are labeled by a blue star. (A) Topological connection structure of infected cities based on live bird trade information. Trading among first-wave cities is indicated by the yellow line. The other cities with trade information to the cities in these networks are complemented beside the cities, and connected by the gray line. The day when the city was infected was marked as day/month below the name of the city. (B) Proposed transmission network for Beijing. (C) Proposed transmission network for Chuzhou, Anhui Province. (D) Proposed transmission network for Fuzhou City, Fujian Province.
