Figures & data
Figure 1 (A) Morphology of the early, mid and full CPEs in SAFV-infected cell lines. Mock-infected cells served as controls for the normal cellular morphology of the respective cell lines. Magnification: ×200. (B) Kinetics of cell death following infection by SAFV. The graph shows the times required for SAFV-infected HEp-2, Vero, Neuro2A, NIH/3T3 and CHO-K1 cells to attain early (10%), mid (50%) and full (100%) CPEs. The CPE levels of the infected cell lines were assessed by two independent researchers every 6 h following infection until the cultured cells achieved full CPE. The three points on the graph correspond to the time points at which the SAFV-infected cell monolayer attained early, mid and full CPE.
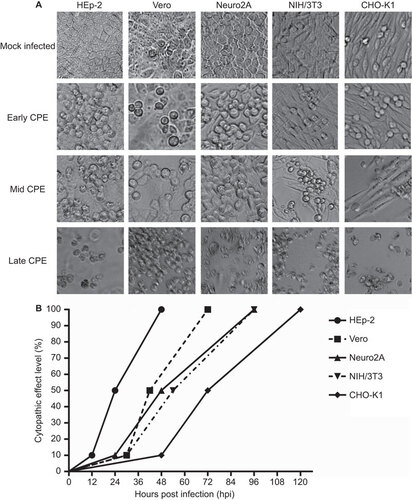
Figure 2 Kinetics of virus growth in SAFV-infected cell lines. Virus titers in culture supernatants expressed as lgCCID50/mL were determined at various 12-h intervals (0, 12, 24, 36, 48, 60 and 72 hpi). Virus titers in culture supernatants were quantified by microneutralization assays using Vero cells. The end point virus titer was enumerated according to the Reed and Muench method Citation25 and is reported as the CCID50. The experiments were performed thrice and the average values with standard deviations are plotted. CCID50, 50% cell culture infectious dose.
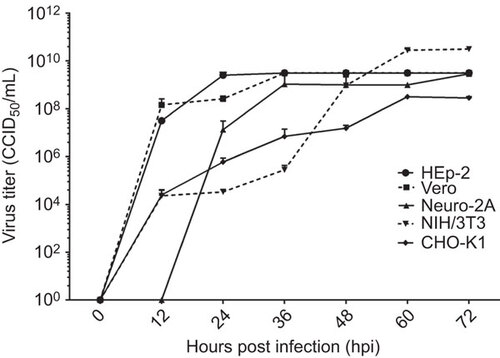
Figure 3 DNA laddering analysis to demonstrate end-stage apoptotic cell death. (A) DNA laddering analysis of Saffold virus-infected cell lines at the early, mid and full CPE time points. The Vero, Neuro2A and CHO-K1 cell lines exhibited DNA ‘smearing’ patterns with early CPE. The NIH/3T3 and HEp-2 cell lines only showed such patterns from mid CPE onward. The CHO-K1 cell line exhibited the characteristic DNA laddering pattern with early CPE. The Neuro2A and Vero cell lines showed the DNA laddering pattern beginning at mid CPE and the NIH/3T3 cell line only showed this pattern at full CPE. Infected HEp-2 cells did not show a DNA laddering pattern. Lanes EC, MC and FC, represent DNA extracted from the SAFV-infected cells showing early, mid and full CPE, respectively. Lanes marked ‘M’ denote the DNA molecular size marker. (B) DNA laddering analysis of STAU-treated cells as positive controls. All cell lines showed a DNA laddering pattern when harvested at 4 h following STAU treatment. Lanes marked ‘STAU’ represent DNA extracted after staurosporine treatment. Lanes marked ‘M’ denote the DNA molecular size marker. The experiments were performed in triplicate and one of the three results is presented.
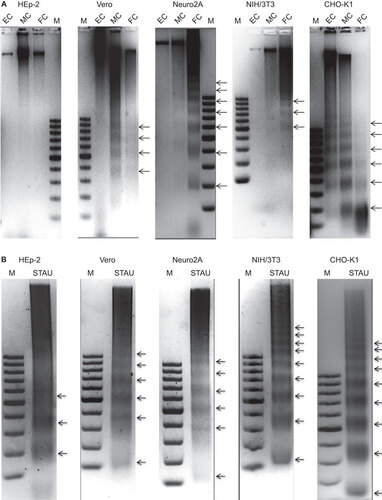
Figure 4 Apo-ONE Fluorometric assay of SAFV-infected HEp-2, Vero, Neuro2A, NIH/3T3 and CHO-K1 cell lines harvested at mid CPE in comparison with mock-infected cells. A paired Student’s t-test was used to compare the fluorometric readings, and differences were considered significant at *P<0.05 and extremely significant at **P<0.01. All experiments were performed in triplicate and the average values with standard deviations are plotted.
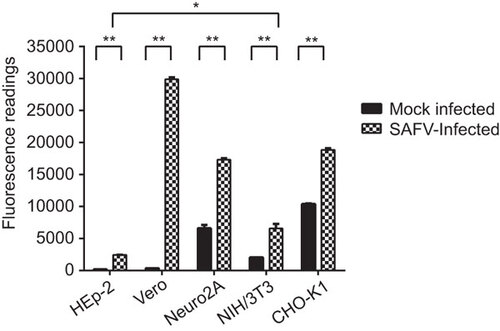
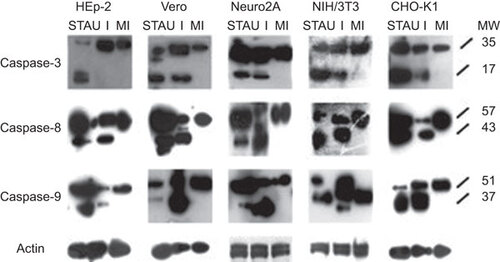
Figure 5 Western blots of cell lysates derived from SAFV-infected HEp-2, Vero, Neuro2A, NIH/3T3 and CHO-K1 cell lines harvested at mid CPE in comparison with respective mock-infected control and STAU-treated control cells. Membranes were stained with respective antibodies against caspases-3, -8, -9 and actin. The intensity of actin staining served as the protein loading control. Lanes with I denote infected cell lysates, lanes with MI denote mock-infected control cell lysates, lanes with STAU denote STAU-treated control cell lysates and lanes with MW indicate the protein molecular mass in kDa. Caspases-3, -8 and -9 were cleaved to their respective active forms (p17, p43 and p37) in SAFV-infected Vero, Neuro2A, NIH/3T3, CHO-K1 cells and all STAU-treated cells. Only caspases-8 and -9 were cleaved to their active forms in SAFV-infected HEp-2 cells. The Western blotting results shown here are representative one of the three replicate experiments.