
Figures & data
Table 1 The mutation profiles and the fluoroquinolone MICs of the 80 ofloxacin-resistant M. tuberculosis isolates
Figure 1 MICs of the three fluoroquinolones for isolates carrying the four most frequent mutations. The transverse lines represent the median MIC for each drug. The D94G and D94N mutations were significantly associated with higher resistance to all three drugs than the A90V and D94A mutations (pair-wise Mann–Whitney U test, ).
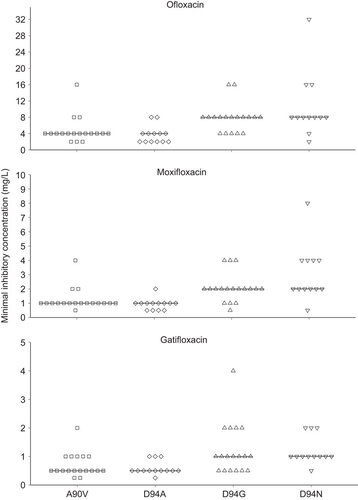
Table 2 Pair-wise comparison of resistance levels of isolates carrying A90V/D94A/D94G/D94N mutations, using the Mann–Whitney U test.