Figures & data
Figure 1 The Gunas of Comarca Madungandí, República de Panamá. (A) Guna children at Puente Bayano elementary school. (B) Comarca Madungandí, República de Panamá. The map shows the location of Comarca Madungandí in relation to Panamá City and Colón. (C) Guna Village at the shore of Lake Bayano. (D) Traditional Guna house with earthen floor, wood walls, thatched roofs and no anti-insect screening. The inset shows the typical eaves that facilitate Anopheles albimanus mosquito infestation.
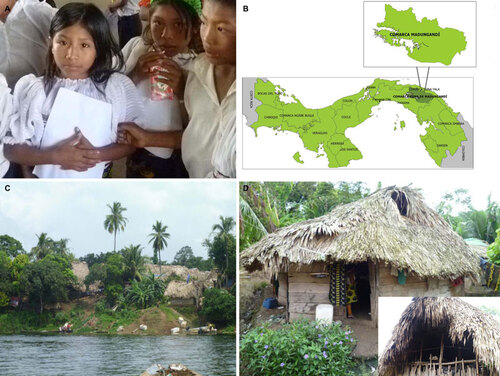
Figure 2 Time series data from Comarca Madungandí, República de Panamá (January 1980–April 2013) and correlation functions (A) Rainfall. (B) Maximum temperature in Comarca. (C) Minimum temperature. Lines represent the trends obtained with LOWESS and EMD. (D) El Niño 4 index, also known as, SST4. (E) Malaria cases per 1000 people. (F) Malaria transmission seasonality. Boxes delimit the 25th to 75th data quantiles, and the lines inside the boxes show the median of the distribution for each month. (G) ACF of the malaria time series shown in panel A. (H) PACF of the time series shown in A. CCF between residuals of a SAR (2, 12) model for malaria cases per 1000 people and pre-whitened: (I) SST4, (J) rainfall, (K) maximum temperature and (L) minimum temperature. In G–L, the dashed lines indicate the 95% CL for the correlations that can be expected by random. CL, confidence limits; LOWESS, locally weighted scatterplot smoothing.
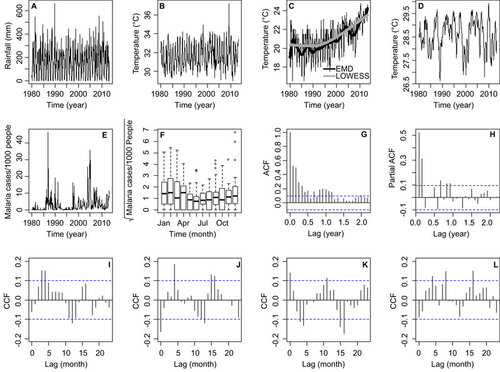
Table 1 Parameter estimates for the best models of malaria incidence (per 1000 people) in Comarca Madugandí, República de Panamá, with and without breakpoints
Figure 3 Breakpoint analysis. BIC for breakpoint selection in (A) minimum temperature and (B) malaria incidence (per 1000 people). The breakpoint in B corresponds to December 2002. Seasonal malaria incidence in (C) January 1980–December 2002 and (D) January 2003–April 2013. In C and D, the boxes delimit the 25th to 75th data quantiles, and the lines inside the boxes show the median of the distribution for each month.
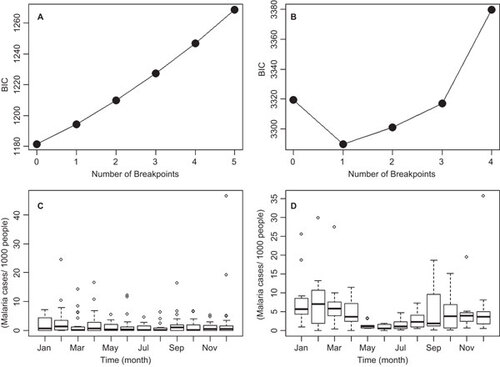
Figure 4 Cross-wavelet coherence analysis. Coherence between SST4 and (A) malaria cases per 1000 people from January 1980 to April 2013, (B) rainfall, (C) maximum temperature and (D) minimum temperature in Comarca Madugandí, República de Panamá. In all analyses, a smoothing window of six months was used. The cross-wavelet coherence scale is from zero (blue) to one (red). Red regions in the plots indicate frequencies and times for which the two series share variability (or power). The cone of influence (within which results are not influenced by the edges of the data) and the significant coherent time-frequency regions (P<0.05) are indicated by solid lines.
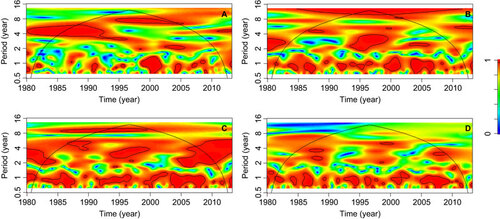
Figure 5 Malaria incidence (per 1000 people) EMD and spectral analysis of IMFs. (A) Residue; (B) first IMF; (C) second IMF. Periodograms for (D) EMD residue, which shows most of the power at inter-annual time scales, i.e., less than one cycle per year; (E) first IMF, which has the highest power at a seasonal time scale, i.e., one cycle per year; and (F) second IMF, which has high variability across the spectra and therefore can be considered as white noise. In D–F, the blue lines are the confidence intervals for the power spectra.

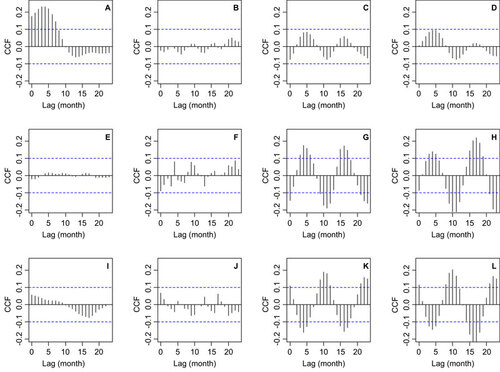
Figure 6 CCF between malaria incidence (per 1000 people) IMFs from an empirical mode decomposition, EMD and climatic factors. EMD residue and (A) El Niño 4 index, also known as, SST4, (B) rainfall, (C) maximum temperature and (D) minimum temperature. First IMF and (E) SST4, (F) rainfall, (G) maximum temperature and (H) minimum temperature. Second IMF and (I) SST4, (J) rainfall, (K) maximum temperature and (L) minimum temperature. In all panels, the dashed lines indicate the 95% CL for correlations that can be expected by random. CL, confidence limit.