Figures & data
Figure 1 Phylogenetic relationships, as inferred from a maximum likelihood analysis of the CAL sequences from 98 strains, covering the main haplotypes of the Sporothrix schenckii complex circulating in Brazil. The numbers close to the branches represent indices of support (NJ/ML/MP) based on 1000 bootstrap replications. The branches with bootstrap support higher than 70% are indicated in bold. ML, maximum likelihood; MP, maximum parsimony; NJ, neighbor-joining. Further information about isolate source and GenBank accession number can be found in the Supplementary Table S1.
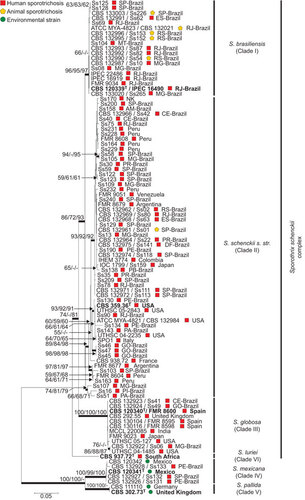
Figure 2 Distribution patterns of 277 Sporothrix spp. in Brazil. (A) Distribution of Sporothrix isolates in Brazil. (B) Distribution of feline sporotrichosis in Brazil, as based on outbreak reports in the literature.Citation7,Citation13,Citation32,Citation33,Citation34 ES, Espírito Santo; MG, Minas Gerais; PR, Paraná; RJ, Rio de Janeiro; RS, Rio Grande do Sul; SP, São Paulo.
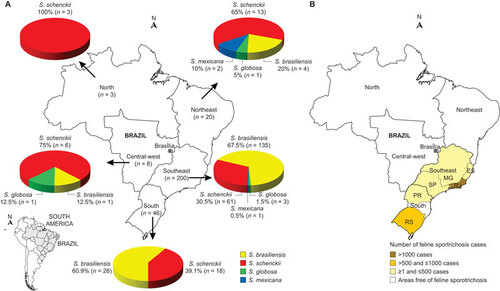
Figure 6 Genetic diversity in the Sporothrix brasiliensis and S. schenckii species, as explored by nuclear and mitochondrial markers. (A) Number of haplotypes, (B) haplotype and (C) nucleotide diversity among the etiological agents of sporotrichosis. The thin bars represent the standard deviation.
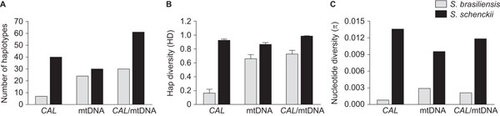
Figure 7 The neighbor network using the uncorrected p-distance among a core set of Sporothrix mitochondrial genotypes. Sets of parallel edges (reticulations) in the networks indicate locations of incongruence and potential recombination. Recombination within S. schenckii s. str. was also supported by the PHI-test (inbox). Possibilities of recombination were rejected for the S. brasiliensis population using NeighborNet and PHI-test analyses, supporting the emergence of a clonal genotype.
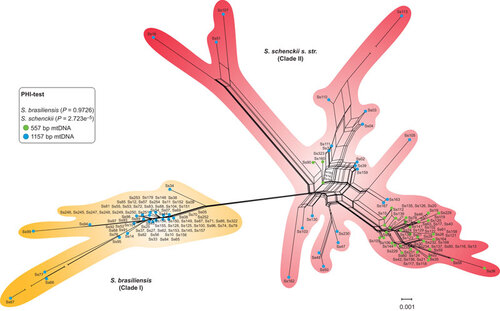
Figure 3 Frequency of clinical pictures between the two most common species in the Sporothrix schenckii complex. The frequencies are compared with previous data reported in the literature.Citation4,Citation5,Citation35 DS, disseminated; EC, extracutaneous; fungemia and mucosa forms; FC, fixed cutaneous; LC, lymphocutaneous.
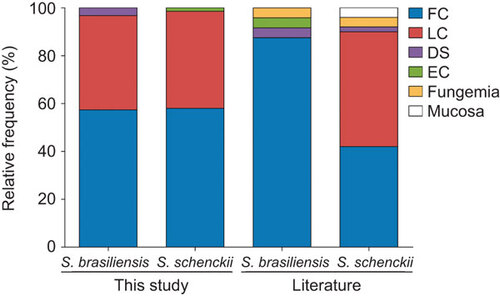
Figure 4 Mitochondrial genotyping of Sporothrix spp. isolates. (A) Genotyping results of polymorphic amplicons, which represent the variability of the intergenic region between COX2 and ATP9 in the mitochondrial genome of different isolates. (B) DNA quality control amplification of the nuclear rRNA operon. (C) Distribution of polymorphic amplicons, according to the phylogenetic species.
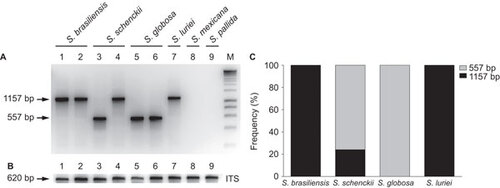
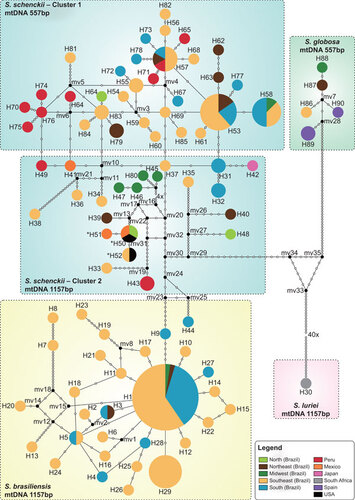
Figure 5 Median-joining haplotype network of Sporothrix schenckii complex isolates, covering all the concatenated mtDNA and CAL haplotypes found in this study. The size of the circumference is proportional to the haplotype frequency. The isolates are coded, and their frequencies are represented by geographic region of isolation. Mutational steps are represented by white dots. The black dots (median vectors) represent unsampled or extinct haplotypes in the population. Three haplotypes (H50–H52), indicated by a bold asterisk (*), present the 557 bp mtDNA rather than the major 1157 bp mtDNA of the group to which they are assigned.