Figures & data
Figure 1 Flow chart of selection process to identify relevant studies assessing the efficacy of C. difficile control bundles.
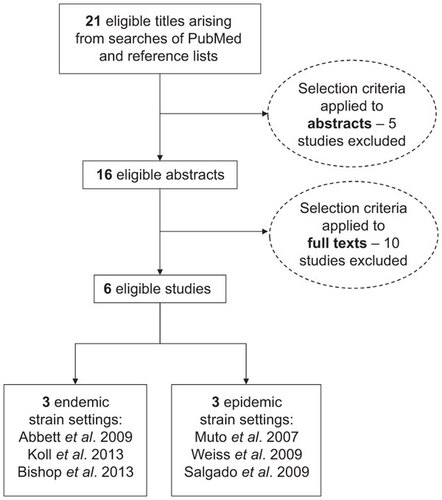
Figure 2 Compartmental design of the stochastic, event-driven mathematical model of C. difficile transmission within a simulated 1000-bed acute care hospital.
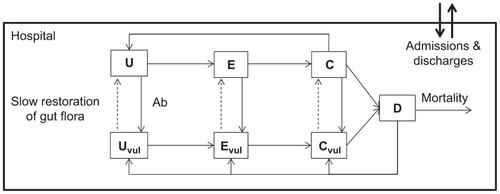
Table 1 Epidemiological model symbology and parameterization
Table 2 Summary of the clinical studies examining the efficacy of control bundles in mitigating Clostridium difficile infection
Figure 3 The effect of control combinations on the ratio of patients discharged relative to those admitted with asymptomatic C. difficile colonization. Controls include: λ, rate of gut microbiota recovery which is expedited by probiotics or intestinal microbiota transplantation; α, rate of antimicrobial prescription which is reduced through stricter stewardship; β, the rate of transmission which is reduced through improvements to hygiene and sanitation; κ, the rate of patient discharge (inverse of average length of stay), which is increased to minimize patient exposure window.
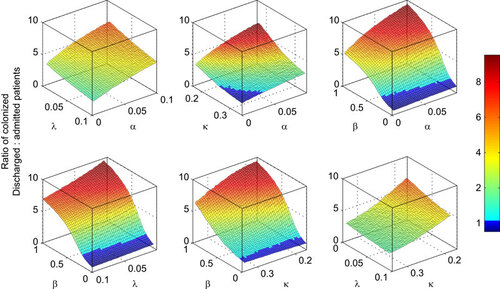
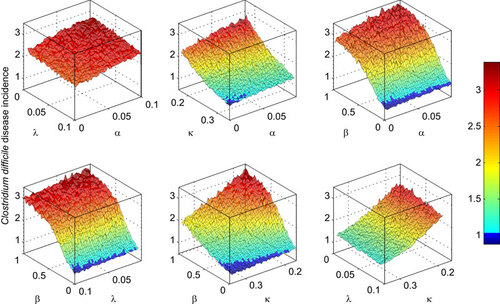
Figure 4 The effect of control combinations on C. difficile symptomatic disease incidence per 1000 hospital bed days. Controls include: λ, rate of gut microbiota recovery which is expedited by probiotics or intestinal microbiota transplantation; α, rate of antimicrobial prescription which is reduced through stricter stewardship; β, the rate of transmission which is reduced through improvements to hygiene and sanitation; κ, the rate of patient discharge (inverse of average length of stay) which is increased to minimize patient exposure window.