Figures & data
Table 1 Fluorescent focus reduction neutralization assay
Figure 1 A surface representation of the VP7 trimer (PDB ID: 3FMG). Each trimer is colored a different shade of gray and the antigenic regions A, C and F are colored light blue, dark blue and mid blue, respectively. The surface exposed amino acid residues that differ between the 2010 G1P[8] Alice Springs outbreak strain and Rotarix® vaccine strain are shown in red.
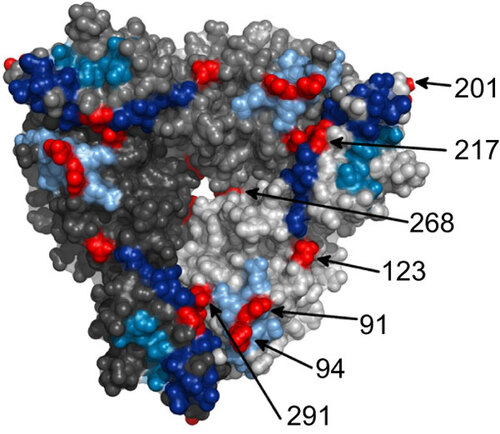
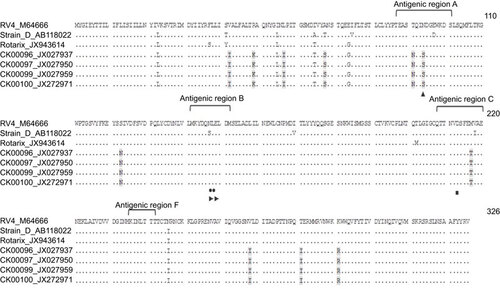
Figure 2 Alignment of VP7 gene of the prototype G1P[8] strains RV4, D, the 2010 G1P[8] Alice Springs outbreak strain and Rotarix® vaccine strain. Amino acid differences between these strains are shaded. Residues comprising the antigenic regions are defined within in brackets. The sites shown to escape neutralization with monoclonal antibodies include RV4:1 (sites 147 and 148, filled circle), RV4:2 (sites 213, filled square), RV4:3 (site 94, filled triangle) and RV4:5: (sites 147, 148 and other undefined sites, filled right pointing triangle).