Figures & data
Figure 1 Immunization with membrane protein fractions derived from biofilm and mid-log and stationary planktonic cultures. Naive adult female BALB/c mice were subcutaneously immunized with 1 µg membrane proteins. Negative controls consisted of adjuvant only (Alum) and PBS, while an acellular vaccine (aP) containing 0.5 µg Ptx, 0.5 µg FHA and 0.16 µg Prn was used as a positive control. Subsequently, mice were infected intranasally with 2×10⁷ CFU of B. pertussis strain B1917. The bacterial load in the lungs and nose was quantified three (A and C) and seven (B and D) days after challenge. Each symbol represents one mouse. Horizontal lines represent the mean. Dashed lines indicate the lower limit of detection. **P<0.005 relative to PBS mice; two-tailed Mann–Whitney U test. FHA, filamentous hemagglutinin.
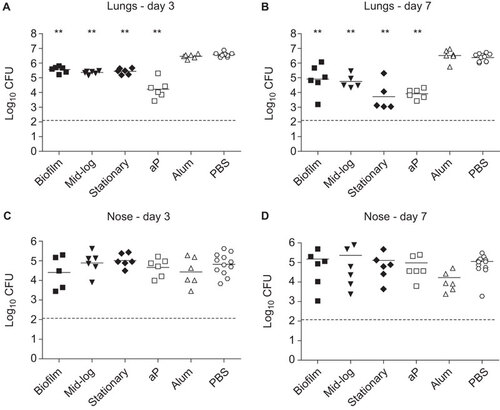
Figure 2 Functional clustering of proteins identified with proteomics. 645 proteins were identified under all three growth conditions (biofilm, planktonic mid-log and planktonic stationary), of which 60 and 48 proteins were found to be upregulated or downregulated, respectively, in biofilms relative to planktonic conditions. The identified proteins were grouped by functional categories (A) and PSORTb-predicated subcellular localization (B). The relative frequencies of biofilm-up- or -downregulated proteins, compared to the total number of annotated proteins identified under all conditions for each functional class, are listed on the right-hand side. Asterisks indicate statistically significant enrichment of biofilm-regulated proteins in a certain class as determined by Fisher's exact test. **P<0.005.
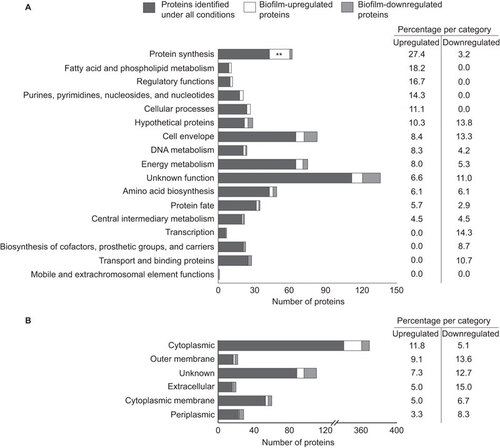
Table 1 Biofilm-associated proteins and vaccine candidate selection criteria
Figure 3 bipA expression during infection. (A) Naive adult female BALB/c mice were infected intranasally with B. pertussis strain B1917. After seven days, bacteria were collected through BAL and used for in vivo transcriptional analysis using bipA-specific primers as described in the text. Expression levels were compared to in vitro Bvg+, Bvgi and Bvg− conditions. The transcription data are expressed as 40−ΔCt value, which is a measure of expression relative to the recA gene (ΔCt=Ct target–Ct recA). *P<0.05, **P<0.005, ***P<0.0005 relative to the Bvg− condition; Student's t-test with Welch's correction. (B) Human serum, from 10 confirmed B. pertussis-infected individuals (Bp+) and four non-infected individuals (Bp−) was diluted and incubated on ELISA plates coated with recombinant BipA or Ptx and the titers were determined. Horizontal lines represent the geometrical mean. **P<0.005, ***P<0.0005 relative to Bp- sera; one-tailed Mann–Whitney U test. BAL, bronchoalveolar lavage.
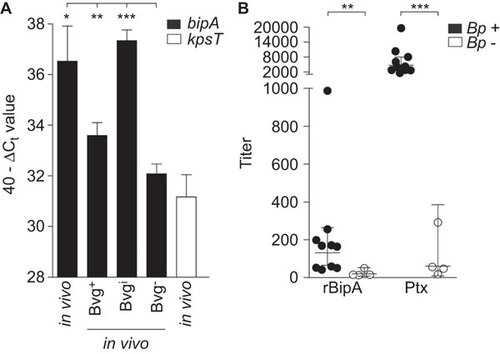
Figure 4 Immunization with rBipA protects against B. pertussis infection. Naive adult female BALB/c mice were subcutaneously immunized with rBipA or controls as described in Figure and infected intranasally with 2×10⁷ CFU of B. pertussis strain B1917. The bacterial load in the lungs and nose was quantified three (A and C) and seven (B and D) days after challenge. Each symbol represents one mouse. Horizontal lines represent the mean. Dashed lines indicate the lower limit of detection. **P<0.005 difference between rBipA and aP and between vaccinated and PBS control mice; two-tailed Mann–Whitney U test.
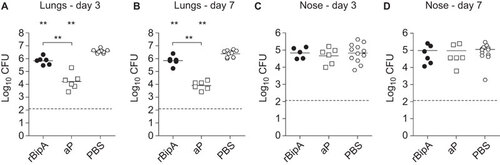
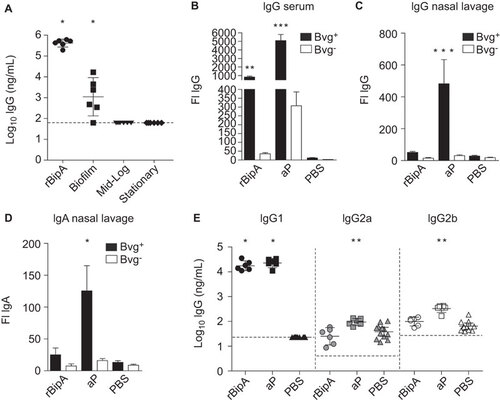
Figure 5 Bacterial opsonization by BipA-specific antibodies. (A) Post-immune mouse sera (day 28) were used to determine the amount of total IgG specific for rBipA using an ELISA. Each symbol represents one mouse and the geometrical mean is represented by a horizontal line. Dashed lines indicate the lower limit of detection (93 ng/mL). *P<0.05; one-tailed Wilcoxon signed-rank test. The binding of serum IgG (B) and nasal lavage IgG (C) and IgA (D) antibodies from vaccinated mice to Bvg+ or Bvg− grown B. pertussis B1917 was determined by flow cytometry. Bars represent the geometric mean±95% CI of six individual mice. **P<0.005, ***P<0.0005 relative to PBS group; Kruskal–Wallis test followed by a Dunns post-hoc test (α=5%). (E) To determine the distribution of IgG subtypes, the amount of pertussis-specific IgG1, IgG2a and IgG2b binding to Bvg+ grown whole B1917 cells was assessed. Each symbol represents one mouse and the geometrical mean is represented by a line. Dashed lines indicate the lower limit of detection (23, 4 and 27 ng/mL for IgG1, IgG2a and IgG2b, respectively). For IgG1, a one-tailed Wilcoxon signed-rank test was performed because IgG1 levels of the PBS mice were below the detection limit. IgG2a and IgG2b levels were statistically compared to the PBS mice using a two-tailed Mann–Whitney U test. *P<0.05, **P<0.005. CI, confidence interval; FI, fluorescence index.