
Figures & data
Figure 1 (A) Detection of B. pseudomallei from soil samples by PCR and culture during the study period and in relation to ambient temperature and rainfall. (B) Monthly number of melioidosis cases in captive animals in the oceanarium between 2002 and 2011. Data showed the cumulative cases in the respective months over a 10-year period (2002-2011).
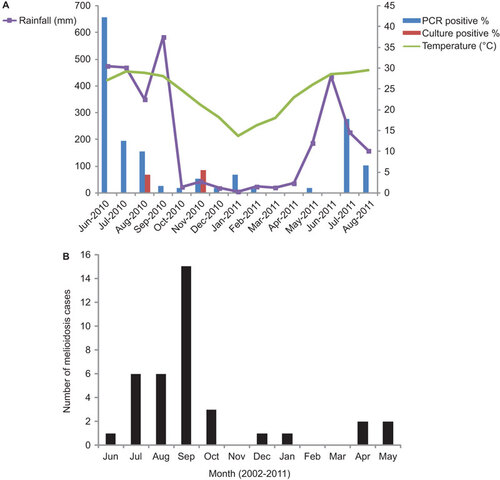
Table 1 Distribution of B. pseudomallei in different locations of the oceanarium
Table 2 Seasonal distribution of B. pseudomallei in the oceanarium
Supplemental material