
Figures & data
Figure 1 Description of the different proteins encoded by the RVFV M segment. (A) Schematic representation of the RVFV M segment in the antigenomic orientation. The relative nucleotide position of the different in-frame AUG codons in the NSm region and the coding regions of NSm, GN and GC are depicted on the upper graph. Transmembrane domains are indicated as gray rectangles. This panel also shows the schematic representation of the polypeptides expressed from each of the AUG codons. Different proteins, including P78 and NSm (red), GN (blue) and GC (green), are generated upon cleavage of polyprotein precursors. (B) Model of protein topology in the context of different AUG usage. (C) Description of the AUG KO mutant viruses produced during this study, with their corresponding protein expression profiles. ER, endoplasmic reticulum.
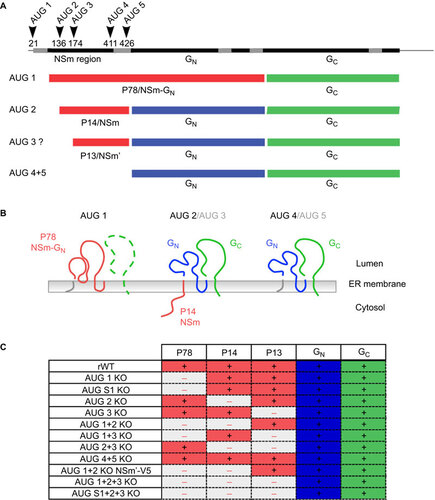
Figure 2 Characterization of protein translation products from AUG 1, 2 and 3 of the M segment. (A) Vero E6 cells were either mock-infected or infected at an MOI of 3 with WT ZH548 virus or with the different AUG KO mutant viruses. Protein lysates recovered at 16 h PI were subjected to Western blot analysis. GN and N were detected with specific Abs, and P78 and NSm were detected with the anti-MC14 Ab. (B) IF and Western blotting analysis of NSm′-V5. Representation of the 3′ end of the M segment of the recombinant AUG 1+2 KO NSm′-V5 virus. The different AUG codons are indicated by arrows, and their nucleotide positions are given. AUG codons that were knocked out are marked by a red cross. The position of the inserted V5-tag immediately downstream of AUG 3 is indicated. Signal sequences appear in gray. For the IF analysis, Vero E6 cells were infected with the AUG 1+2 KO NSm′-V5 mutant virus at an MOI of 3. Cells were fixed 16 h PI and stained with Abs specific for the viral proteins GN and N. Scale bars represent 20 µm. For the Western blot analysis, Vero E6 cells were either mock-infected or infected with the WT ZH548 virus or infected with the AUG 1+2 KO NSm′-V5 mutant virus, and the cell lysates were analyzed with an anti-V5 Ab. The molecular weight and position of the marker bands are indicated (right panel).
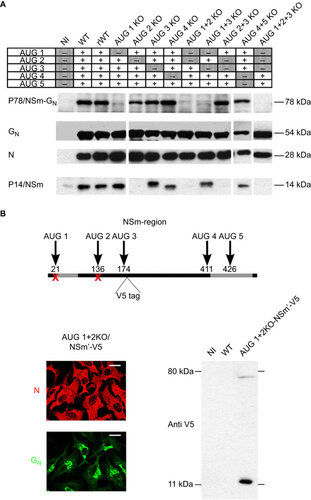
Figure 3 Subcellular localization of the NSm and NSm′ accessory proteins. (A) Vero E6 cells infected with either WT ZH548 virus or different AUG KO mutant viruses were fixed 16 h PI and stained with specific antibodies for the mitochondrial marker TOM22 and the anti-NSm MC14 Ab. Colocalization of the two signals is indicated by a yellow label in the merged images. (B) Vero E6 cells were either infected with the AUG 1+2 KO NSm′-V5 virus at an MOI of 3. Cells were fixed 16 h PI and stained with specific Abs for TOM22 (green) and V5 (red). Scale bars represent 20 µm.
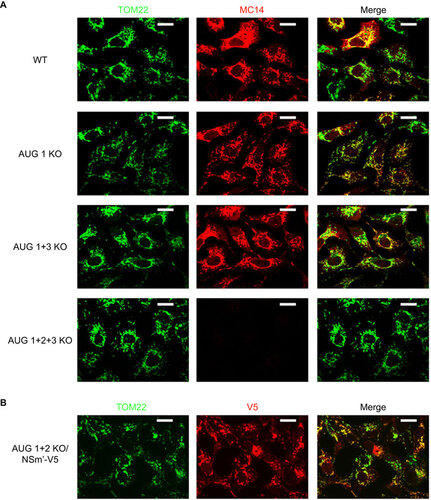
Figure 4 Residual virulence of the AUG KO mutant viruses in C57BL/6 mice. (A, B) Six 8-week-old C57BL/6 mice were mock-infected (NI) or infected with 100 PFU of rescued WT virus (ZH548) or with 100 PFU of the different AUG KO mutant viruses knocked out for one of the first three in-frame AUG start codons present at the 5′ end of RVFV M segment (A) or for two of the five start codons (B). Mice were monitored over a period of 3 weeks, but no changes in survival rates were observed after day 14. (C) Eight-week-old C57BL/6 mice were infected with 100 PFU of rescued WT virus (ZH548) or with 100 PFU of the AUG 1 KO, AUG S1 KO, AUG 2+3 KO or AUG 1+2+3 KO mutant viruses. (D) Survival curve of C57BL/6 mice infected with different doses of rescued WT ZH548 virus or AUG 2+3 KO virus. Eight-week-old C57BL/6 mice were infected with 1, 10 or 100 PFU of rescued WT ZH548 virus or 100, 1000 or 10 000 PFU of the AUG 2+3 KO mutant virus.
Figure 5 Growth behavior of the selected AUG KO viruses in cell culture. (A) Virus production in fibroblasts. L929 cells were infected at an MOI of 0.01 (left panel) or 3 (right panel). Supernatants were harvested at different time points, and virus production was quantified using plaque assays. (B, C) Virus production in RAW 246.7 cells. Cells were infected at an MOI of 0.01 (B left panel, C) or 3 (B right panel), and virus production was quantified using plaque assays. (D) Virus production in C6/36 cells infected at an MOI of 0.01. Virus production was monitored for 96 h PI. All values correspond to the average of a biological triplicate, and the corresponding error bars are reported. Growth curves are representative of several independent experiments.
Figure 6 Infection of Aedes aegypti mosquitoes by WT and AUG KO mutant viruses. (A, B) Female Aedes aegyti mosquitoes were infected with WT or mutant RVFV by ingestion of blood meals containing preparations of infectious viruses (titer 6.6×10⁷ PFU/mL). Viral loads were analyzed in the bodies and heads of the infected mosquitoes using plaque assays on different days PI. (A) Infection rates are given as the number of positive bodies divided by the total number of mosquitoes. (B) The dissemination rate was calculated from the number of positive heads relative to the total number of mosquitoes. The infection and dissemination rates were analyzed at 14 days PI (left panel) and 21 days PI (right panel).
Table 1 The nucleotidic context of AUG codons present in the NSm region of the RVFV M segment (adapted from Cavener[52])