
Figures & data
Table 1 Genome features of Leptospira spp.
Figure 1 Workflow for the de novo assembly of the L. santarosai serovar Shermani genome. CI, chromosome I; CII, chromosome II; OM, optical mapping.
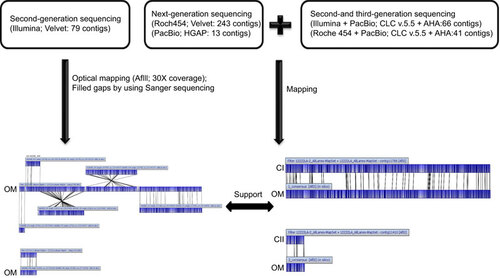
Table 2 Statistics for de novo assembly of the L. santarosai serovar Shermani strain LT821 (ATCC number 43286) genome.
Figure 2 A circular representation of the L. santarosai serovar Shermani genome, with predicted CDSs. (A) Chromosome I; (B) chromosome II. The inner scale is shown in kb. Circles range from 1 (outer circle) to 6 (inner circle). Circles 1 and 3, genes on forward and reverse strands of CDSs; circles 2 and 4, genes on forward and reverse strands of Clusters of Orthologous Group categories; All genes are color-coded according to their functions: red for lipid transport and metabolism (I), lime for carbohydrate metabolism (G), tan for coenzyme transport and metabolism (H), maroon for translation, ribosomal structure and biogenesis (J), blue for cell motility (N), goldenrod for inorganic ion transport and metabolism (P), cyan for post-translation modification, protein turnover and chaperones (O), plum for signal transduction mechanism (T), yellow for secondary metabolites biosynthesis (Q), green for amino acid transport and metabolism (E), olive for energy production and conversion (C), dark khaki for cell division/chromosome partitioning (D), magenta for nucleotide transport and metabolism (F), indigo for transcription (K), purple for replication, recombination and repair (L), dark cyan for cell wall/membrane/envelope biogenesis (M), dull gray for general function prediction only (R), silver for unknown functions (S); circle 5, GC content; circle 6, GC bias ((G-C)/(G.C). This figure was prepared in CGView.
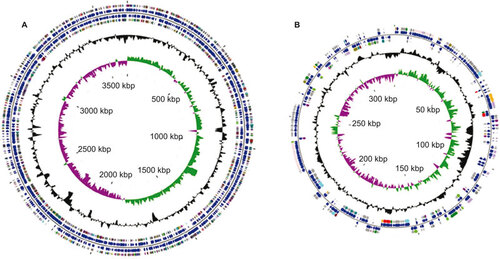
Figure 3 A circular genome map for L. santarosai serovar Shermani compared with pathogenic Leptospira spp. The sequence similarity detected by BLASTp comparison analysis of chromosome I (A) and chromosome II (B) of pathogenic Leptospira spp. using L. santarosai serovar Shermani as a reference were performed with CGView Comparison Tool software. The circles are colored according to the percent identities of matches (black to light red, 100%–50% identity; blue to light blue, 50%–10% identity; and colorless, 0% identity). From the inner to outer circle on A: GC skew and GC content of L. santarosai serovar Shermani, L. borgpetersenii Hardjo-bovis serovar JB197, serovar L550, L. interrogans Copenhageni serovar Fiocruz L1-130, L. interrogans Lai serovar 56601 and strain IPAV, forward and reverse strand CDSs of L. santarosai serovar Shermani. From the inner to outer circle on B: GC skew and GC content of L. santarosai serovar Shermani, L. interrogans Copenhageni serovar Fiocruz L1-130, L. borgpetersenii Hardjo-bovis serovar JB197, L. interrogans Lai serovar 56601 and strain IPAV, L. borgpetersenii Hardjo-bovis serovar L550, forward and reverse strand CDSs of L. santarosai serovar Shermani.
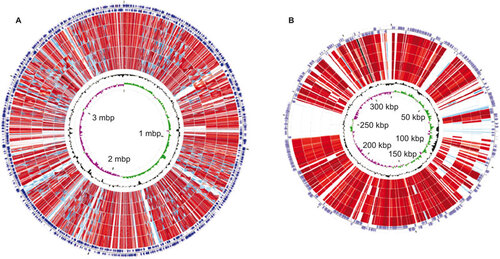
Table 3 Unique regions belonging to GIs and containing unique genes in L. santorosai serovar Shermani
Figure 4 A comparative analysis of differential leptospiral gene expressions in L. santarosai serovar Shermani-infected HK-2 cells (A) and L. interrogans serovar Copenhageni-infected HK-2 cells (B). Data are represented as the means±SD of three independent experiments.
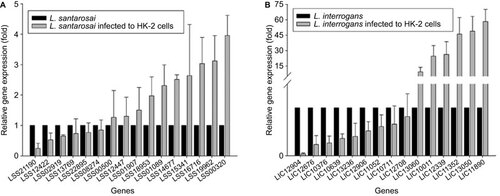
Table 4 Genes for leptospiral gene expression analysis in cell-based infection models.