Figures & data
Figure 1 Location of STLV-4-positive gorillas and STLV-4-negative non-human primates in Cameroon. Mitochondrial hypervariable region 1 haplotypes are included following animal names or specimen numbers (i.e. C1, C2 and D2). Triangles show location where captive animals were confiscated which may not be the same location the animals were caught in the wild.
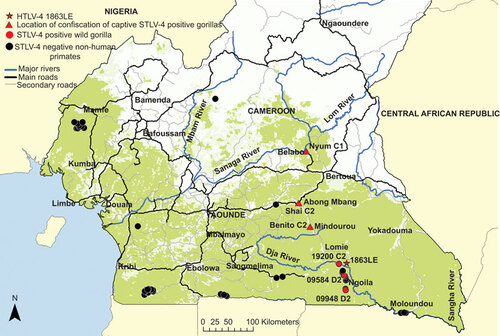
Figure 2 Gorilla mitochondrial hypervariable region 1 haplotype determination. Haplotypes inferred by neighbor-joining analysis using an alignment of eight new sequences from the current study and 158 reference sequences available at GenBank. Final alignment length was 210-bp. Bootstrap support ≥70 is provided at branch nodes. Nuclear mtDNA sequences were not included in the analysis. Gorilla sequences 51461 and 51323 are from different time points from the same animal (Nyum), whereas the two sequences from gorilla 9948 are different clones prepared at different times to verify the robustness of the cloning procedure and phylogenetic analysis.
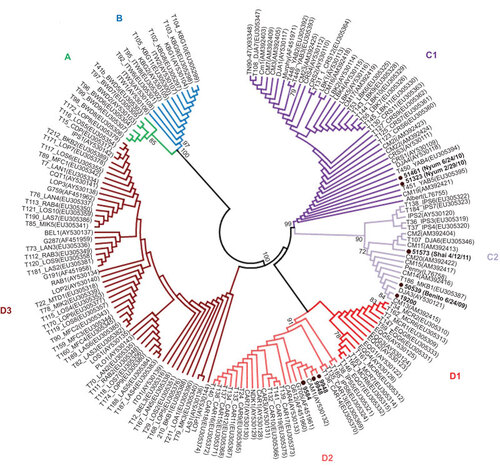
Table 1 Prevalence of STLV-4 in NHPs from Cameroon
Figure 3 HTLV Western blot serologic pattern of STLV-4-infected captive gorillas from Cameroon. Asterisks indicate specimens with indeterminate Western blot results. Positive controls are those supplied with manufacturer's kit. Reactivity to HTLV-specific proteins is indicated on the left.
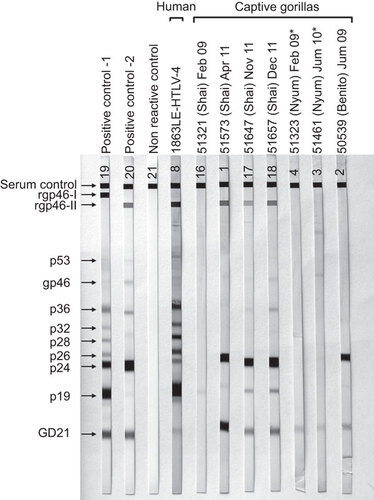
Table 2 Identification of PTLV-4 in gorillas from Cameroon
Figure 4 Identification of STLV-4 in gorillas from Cameroon. Phylogenetic trees inferred using Bayesian analysis in the BEAST program and a relaxed molecular clock. (A) Topology inferred using a 225-bp alignment of tax sequences; (B) topology inferred using a 376-bp alignment of first and second coding position pol sequences; (C) topology and divergence dates inferred using first and second codon positions of concatenated gag, pol and env sequences. Scale bars show units of time and for the concatenated sequences is years to the most recent common ancestors backwards in time from PTLV sequences. Posterior probabilities ≥0.7 are provided at branch nodes.
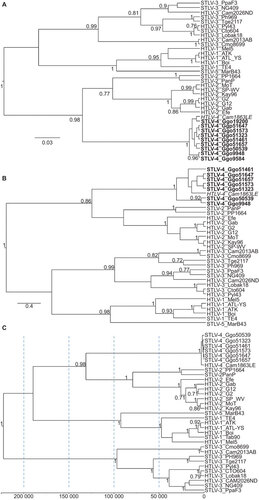
Figure 5 Detection of nucleotide substitutions and APOBEC-induced hypermutation in alignments of complete and partial PTLV genomes. Analysis performed using the Hypermut and Highlighter programs at the HIV sequence database at the Los Alamos website (http://www.hiv.lanl.gov/). Sequence differences and evidence of hypermutation were determined by comparison with the complete genome of (A) HTLV-4(Cam1863LE) or (B) STLV-3(CTO604) and are highlighted as follows: A, Green; T, red; G, orange; C, light blue; IUPAC, dark blue; gaps, gray; circle, APOBEC; diamond G>A. Base number is shown on x-axis, y-axis has no units and is used for only locating reference and query sequences.
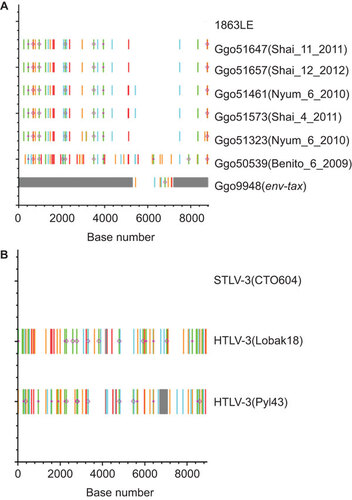
Table 3 PTLV evolutionary time-scale inferred using Bayesian analysis and first and second codon positions of concatenated gag, pol and env genes
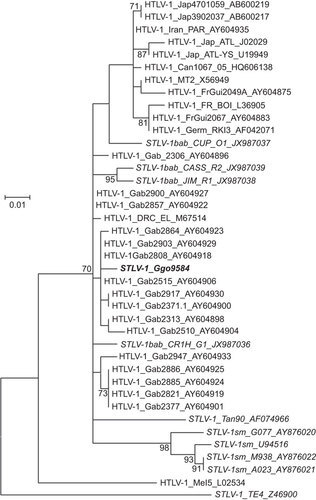
Figure 6 STLV-1 co-infection of a wild gorilla from Cameroon. Identification of STLV-1 genotype in a wild gorilla using maximum likelihood phylogenetic analysis of 325-bp envelope sequences. Reference sequences were available at GenBank and accession numbers are provided in sequence names. One thousand non-parametric bootstrap replicates were used to assess the strength of the branching order. Bootstrap values ≥70 are provided at branch nodes. Scale bar is substitutions per site. PTLV-1 subtypes are provided. Country codes are: Gab, Gabon; Jap, Japan; FrGui, French Guinea; FR, France; Can, Canada; Germ, Germany; Mel, Melanesia. Simian codes are: sm, sooty mangabey; bab, baboon; Ggo, gorilla; Tan, tantalus monkey.