
Figures & data
Figure 1 Replication kinetics of the wild-type virus and the R292K variant in MDCK cells. Confluent MDCK cells were infected with an MOI of 0.001 PFU per cell. Supernatants were collected at the time points indicated and titrated in MDCK cells using a TCID50 assay. Each data point represents the log10 mean±SEM TCID50/mL from three replicated wells. The experiments were repeated twice.
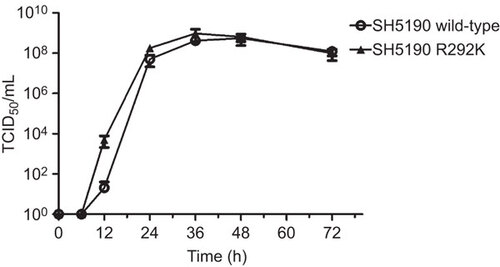
Figure 2 Plaque morphology of the wild-type (SH5190) and the R292K variant (SH5190 R292K) in the absence or presence of oseltamivir carboxylate (10–1000 µM).
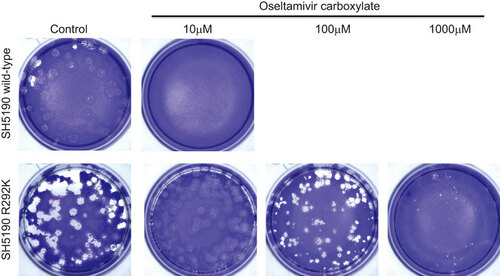
Figure 3 Dose–response curve of the SH5190, SH5190 R292K and the A(H1N1)pdm09 (2167) viruses in the presence of oseltamivir carboxylate (A), zanamivir (B) and peramivir (C) using a chemiluminescent (NA-star) assay. The NA activity of the H7N9 or H1N1 viruses under increasing concentrations (0.03–1000 nM) of the NAIs was determined. Each data point represents the normalized mean ± SEM neuraminidase activity from three replicated wells. The experiments were repeated twice.
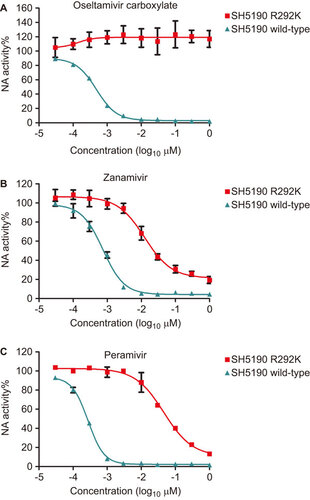
Table 1 IC50 value of the neuraminidase inhibitor in NA-star assay
Figure 4 The sensitivity of the wild-type and the R292K virus to oseltamivir carboxylate, zanamivir, peramivir, T705, ribavirin and NT-300 in MDCK cells. MDCK cells were infected with the wild-type or R292K variant at a dose of 50 PFU/well and were incubated at 37 °C for 1 h, after which the inoculum was removed. Antiviral compounds were diluted to specified concentrations, added in the culture and incubated at 37 °C. Supernatants were collected 24 h post infection and viral loads under different antiviral compounds were quantified using qRT-PCR to determine the influenza A virus HA gene copy numbers. Each data point represents the mean ± SEM of log10 copy number from three replicated wells. The experiments were repeated at least three times.
Table 2 Cell culture-based IC50 values of NAIs and non-NAIs
Table 3 Combination Index for selected NAIs and non-NAIs against R292K-resistant H7N9 virus
Figure 5 Pathogenicity of the H7N9 wild-type and the R292K variant in the mouse model. C57BL/6 mice (n=11 per group) were infected with 105 (high dose) or 103 (low dose) PFU of either the wild-type virus or the R292K variant. The mean ± SEM of mouse weight changes (%) were recorded daily for 15 days (A); viral loads (influenza A virus HA gene copy numbers) in mouse lungs collected on days 3, 8 and 11 post infection in high-dose groups were quantified using real-time one-step qRT-PCR and expressed as mean ± SEM of log10 copy number. (B); mouse survivals after inoculation with the wild-type or the R292K variant at different doses were recorded and plotted (C). N.D. not detectable. These experiments were performed twice.
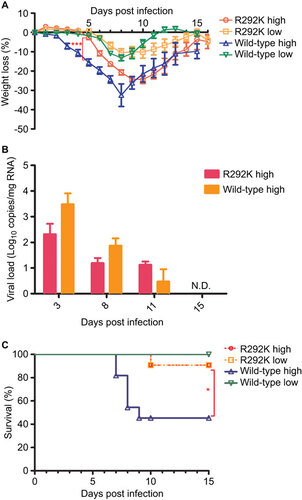
Figure 6 Hematoxylin and eosin staining of lung tissues collected on the eighth day after infection with high-dose R292K mutant virus (A: ×100 magnification, B: ×200 magnification) and wild-type (C: ×100 magnification, D: ×200 magnification).
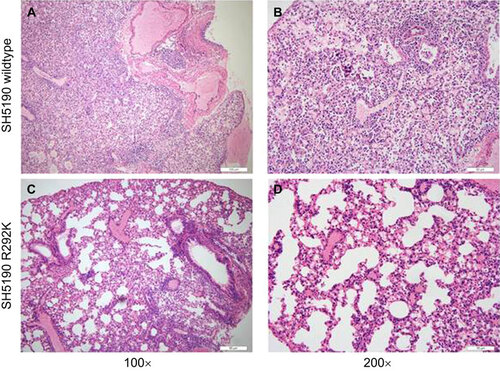
Table 4 Fitness of R292K mutant H7N9 influenza viruses in experimental models